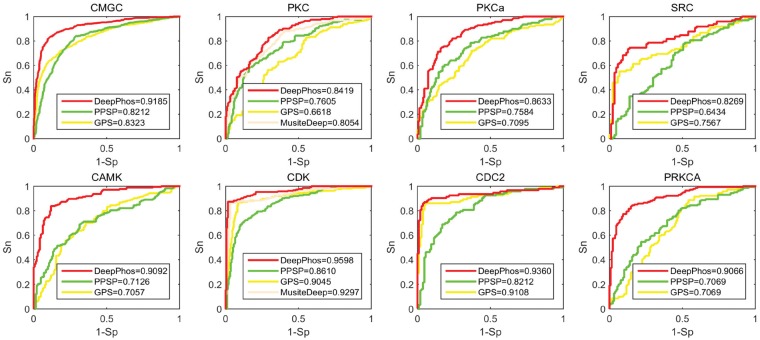
Fig. 3.
ROC curves of DeepPhos and other predictors for group CMGC, group CAMK, family PKC, family CDK, subfamily PKCa, subfamily CDC2, kinase SRC and kinase PRKCA. Here, DeepPhos (red lines) is compared with PPSP (green lines), GPS (the yellow lines) and MusiteDeep (light orange lines) (Color version of this figure is available at Bioinformatics online.)

