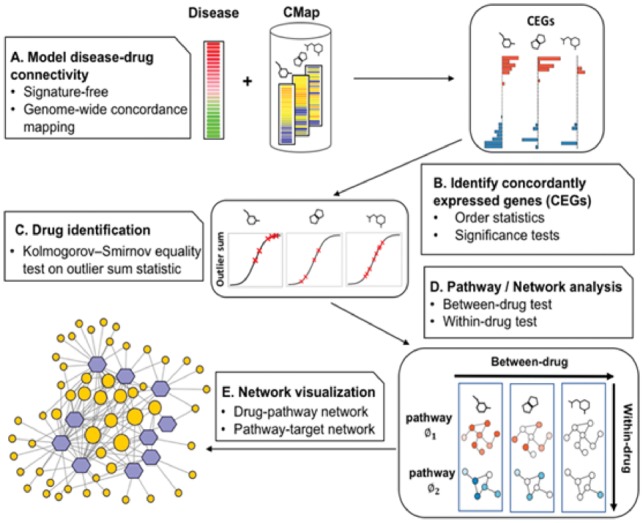
Fig. 1.

Workflow of Dr Insight. (A) The gene rank list from the differential analysis (e.g. tumor versus normal) on the disease dataset is used as input. The reference database contains the gene rank lists (drug instances) from CMap. (B) Type 1 and type 2 CEGs are identified using order statistics. The bar plot shows the log P-values of type 1 (blue) and type 2 (red) CEGs. (C) An outlier-sum score (OS) is calculated for each drug instance and are used to perform K-S test, where the OS scores of the instances from one drug treatment set (red x’s) are compared against the rest of the drug instances. (D) Between-drug and within-drug tests are performed to identify disease-specific drug-pathway regulations. The node is colored by the average z-scores of CEGs within a pathway. (E) The output of Dr Insight: a drug-pathway connection network. The size of the pathways (orange circles) are proportional to their node degrees
