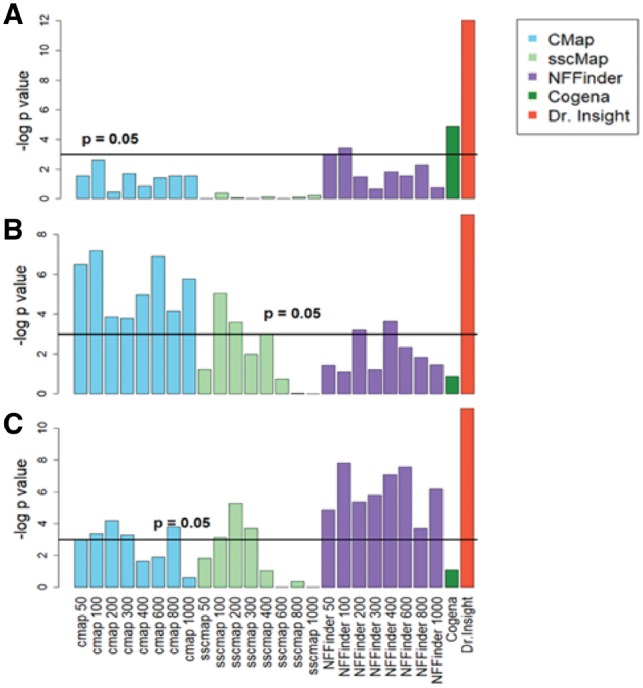
Fig. 3.

Comparing Dr Insight with existing methods on cancer datasets. The bar plots give the log-transformed enrichment P-values from the five methods. Multiple enrichment P-values are reported for CMap, sscMap and NFFinder, which correspond to query signatures of different sizes. The horizontal lines indicate the 0.05 statistical significance level. (A) TCGA breast cancer dataset. (B) TCGA prostate cancer dataset. (C) GEO prostate cancer dataset
