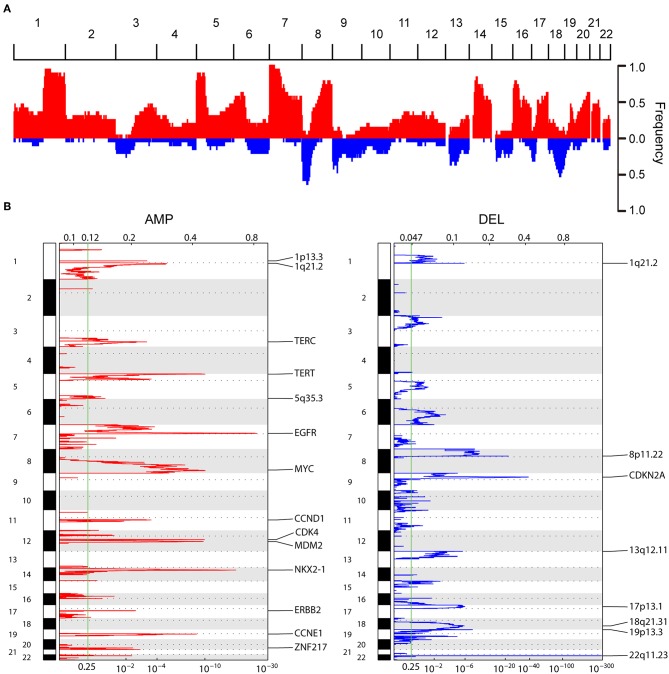
Figure 2.
Composite copy number profiles for LUAD tumors. (A) Frequency plot s of CNAs distribution in 163 LUAD patients, red and blue indicate gain and loss, respectively (B) GISTIC2.0 focal amplifications (red) and deletions (blue) for 163 LUADs. Peaks with an FDR < 0.25 are annotated with candidate oncogenes, tumor suppressors or cytobands.

