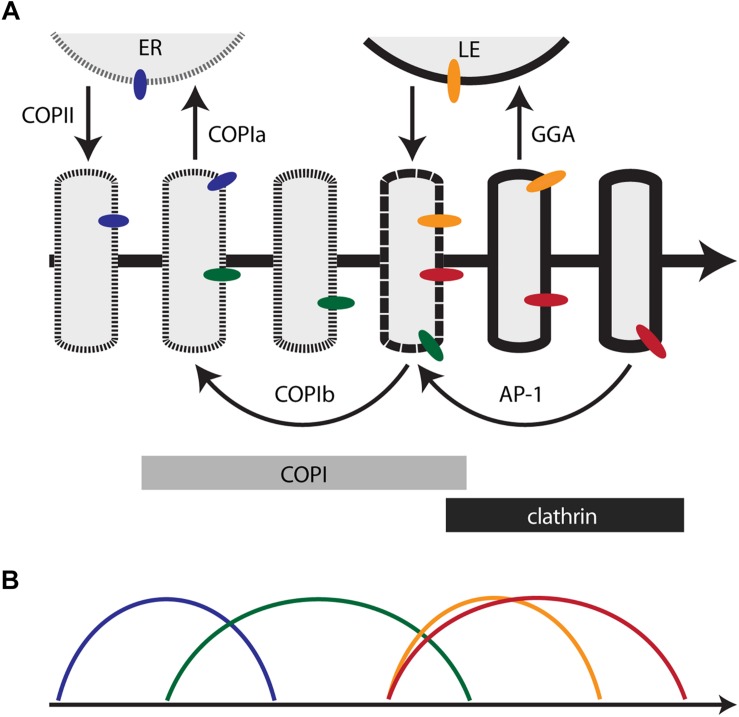
FIGURE 1.
Membrane traffic and the localization of resident transmembrane proteins in the maturing Golgi. (A) Diagram of the core membrane traffic pathways that operate at the Golgi. The thick arrow represents the time course of maturation. An individual cisterna evolves along the time axis. In a stacked Golgi, the cis-to-trans spatial axis would also map onto the time axis. The border of the cisterna changes with time to reflect progressive changes in the lipid bilayer. Thin arrows represent vesicular transport pathways, with relevant coats or adaptors labeled. Bars indicate the approximate residence times for COPI and clathrin on the maturing cisterna. Colored ovals represent Golgi transmembrane proteins that follow different recycling pathways. ER, endoplasmic reticulum; LE, late endosome. (B) Predicted kinetic signatures for four different classes of Golgi transmembrane proteins. The colors correspond to those of the colored ovals in (A). See the text for details.

