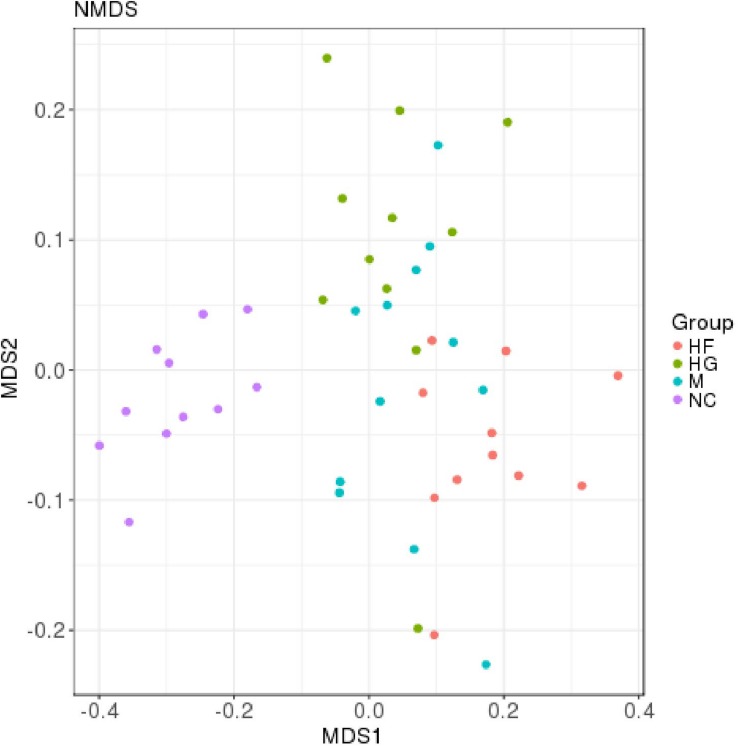
FIGURE 1.
Distribution of gut microbiota according to different gestational status, related to Supplementary Figure S1. Microbial communities clustered using NMDS analysis. Each point represents one sample of NC (purple, n = 11), HG (green, n = 11), HF (red, n = 11) and M (blue, n = 12) pregnant women. The distance among different samples reflects the comparability of four cohorts.

