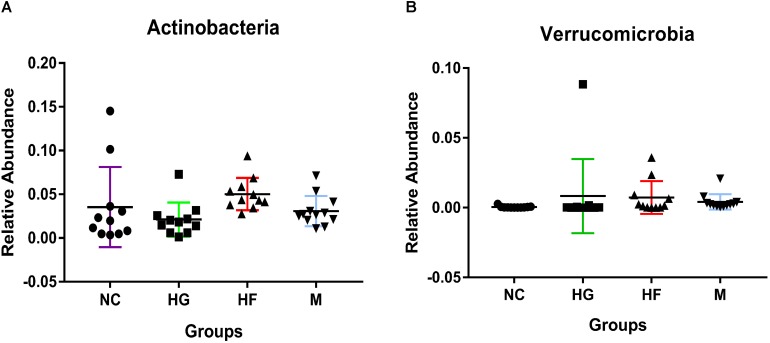
FIGURE 3.
Phylum-level relative abundance of bacteria that in fecal samples was significantly different between the four cohorts NC, HG, HF, and M cohorts. Kruskal–Wallis test was used to compare the differences in the relative abundance of bacterial phylum between the four cohorts. (A,B) Indicate the significant differences (P < 0.05) between the four cohorts.

