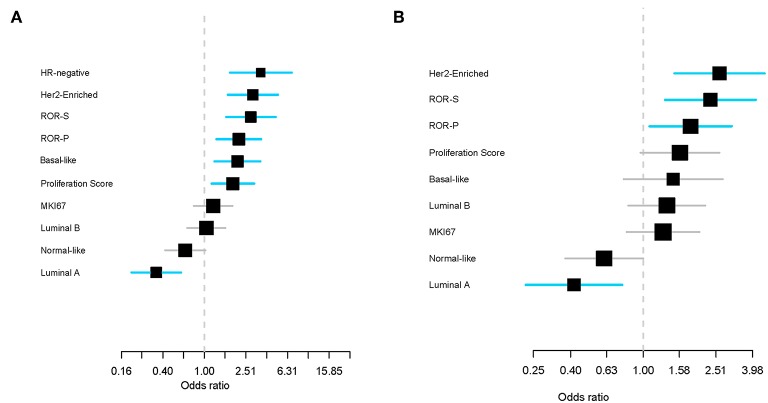
Figure 4.
Effect of PAM50 signatures (as continuous variables) on pathological complete response (pCR) in the univariate analysis (A) and after adjusting for hormone receptor variables (B). Each signature has been standardized to have a mean of 0 and a standard deviation of 1. The size of the square is inversely proportional to the standard error. Horizontal bars represent the 95% CIs of ORs. Statistically significant variables are shown in blue. Each gene signature has been evaluated individually and ranked ordered based on the estimated OR. ROR-S, risk of recurrence score based on subtype; ROR-P risk of recurrence score based on subtype and proliferation.

