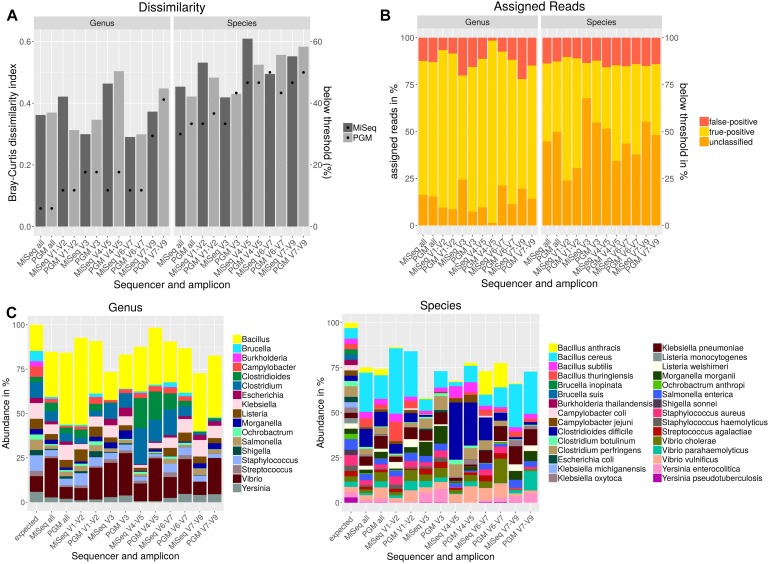
FIGURE 3.
Taxonomic composition after NGS of a mock community standard with PGM and MiSeq using individual amplicons encompassing up to three variable regions (V) of the 16S rDNA gene. Bray–Curtis dissimilarity indices (bars) and the amount of species detected below a threshold of 10% of the expected abundance (dots) are plotted (A). The amounts of false-positive, true-positive and unclassified reads on genus and species level are shown in a staggered bar chart (B). Taxonomic abundance profiling on genus and species level was performed with Qiime and NCBI database for indicated variable regions (C).

