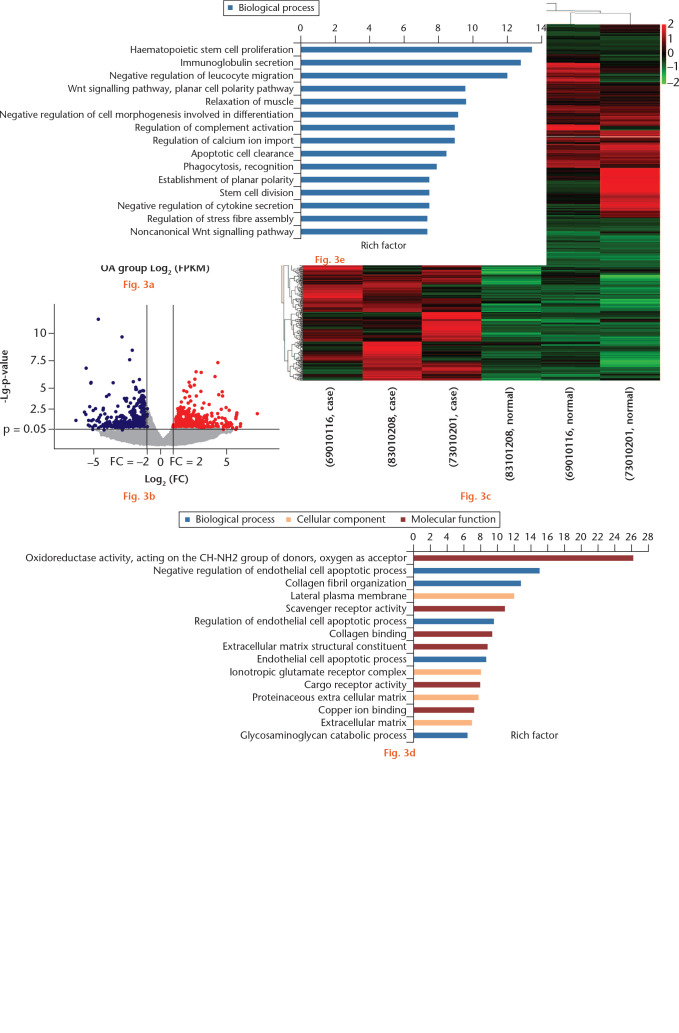
Fig. 3.
Differentially expressed genes (DEGs) in whole-transcriptome sequencing of osteoarthritic (OA) and normal tissue of knee articular cartilage. a) Scatter plot of messenger RNA (mRNA) expression. The mRNAs, represented as red points (high level) and blue points (low level), indicated a more than two-fold change of mRNAs between control normal and OA cartilage samples. b) Volcano plot of the differentially expressed mRNAs. The red points (high level) and blue points (low level) in the plot represent the differentially expressed mRNAs with statistical significance. c) Hierarchical clustering shows a difference in mRNA expression profile between the two groups and homogeneity within groups. d) The top 15 highest enriched gene ontology (GO) terms for downregulated mRNAs in the intact cartilage. e) The top 15 highest enriched GO terms for upregulated mRNAs in the intact cartilage. FPKM, fragments per kilobase of transcript per million mapped reads; FC, fold change; ESCRT, endosomal sorting complexes required for transport; cAMP, cyclic adenosine monophosphate.

