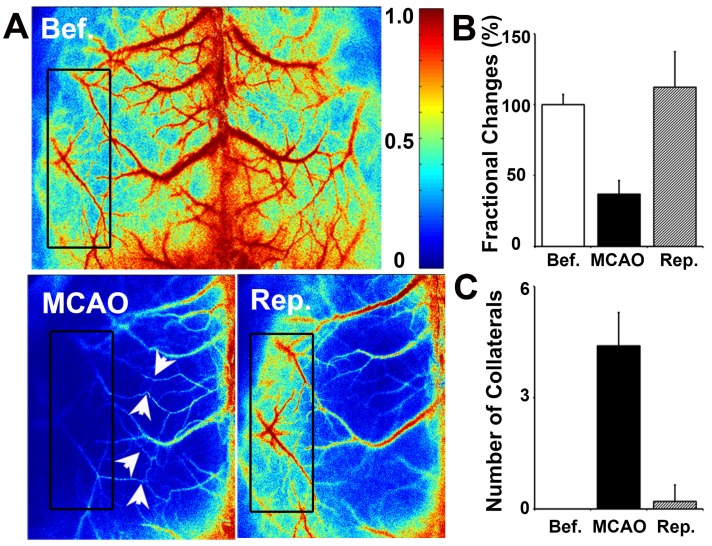
Figure 3.
Cortical collateral perfusion after MCAO as detected by LSCI. A) Cortical blood flow was measured on the mouse skull by LSCI. The colors from blue to red represent the blood flow velocity from lower to higher. Representative images show the LSCI before MCAO (upper), during MCAO (bottom left), and after MCAO (bottom right) in living mice. The black box indicates the measurement of collateral circulation located on the surface of the brain in living mice. The bar graph shows the number of perfused collaterals (B) and the fractional changes (C) before and after 1 h of MCAO as well as after reperfusion. n=6 per group, p<0.05, before MCAO vs. after MCAO, or in MCAO vs. in reperfusion.

