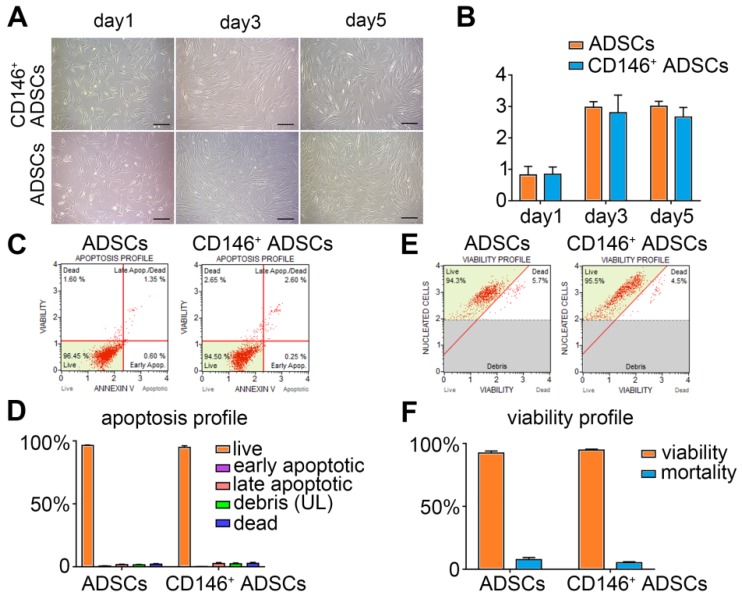
Figure 3.
Proliferation, apoptosis, and viability of CD146+ ADSCs before and after MACS enrichment. (A) Morphology of CD146+ ADSCs and donor-matched ADSCs on day 1, 3, and 5. Cells were cultured at the same density on day 1. Scale bar: 50 μm. (B) Cell proliferation CCK8 assay of ADSCs and CD146+ ADSCs. *P < 0.05, pairwise comparisons, Student's t-test. (C) Apoptosis in ADSCs and CD146+ subpopulation was determined by flow cytometric analysis. (D) The proportion of apoptotic ADSCs and CD146+ subpopulation. The proportions of live, early apoptotic, late apoptotic, debris, and dead cells of the CD146+ subpopulation are shown in mean ± standard error, ***P < 0.05 by Student's t-test compared with ADSCs. (E) Viability in ADSCs and CD146+ cells by flow cytometry. (F) Cell viability of ADSCs and CD146+ subpopulation. The proportions of live and dead CD146+ cells are shown in the mean ± standard error of the mean, ***P < 0.05 by Student's t-test compared with ADSCs.

