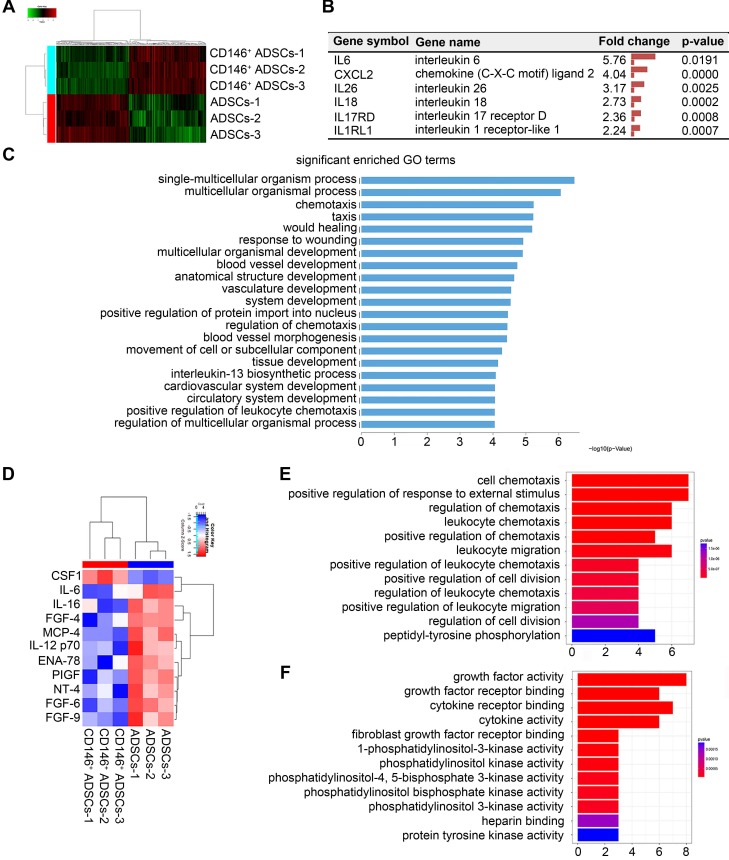
Figure 4.
Gene and protein expression of CD146+ ADSCs before and after MACS enrichment. (A) Heatmap showing transcription expression profiles of ADSCs and the CD146+ subpopulation. Differentially expressed genes are shown. Each block represents the relative transcript level of an individual gene. Each column represents the profile of an individual group. (B) List of inflammation related genes that were significantly changed in CD146+ cells. (C) GO classification of genes by biological process. (D) Cytokine expression of ADSCs and CD146+ cells. Samples were collected from cell protein. Heatmap showing cytokine expression profiles of ADSCs and CD146+ cells. (E) GO classification of proteins by molecular function. (F) KEGG pathway of proteins.

