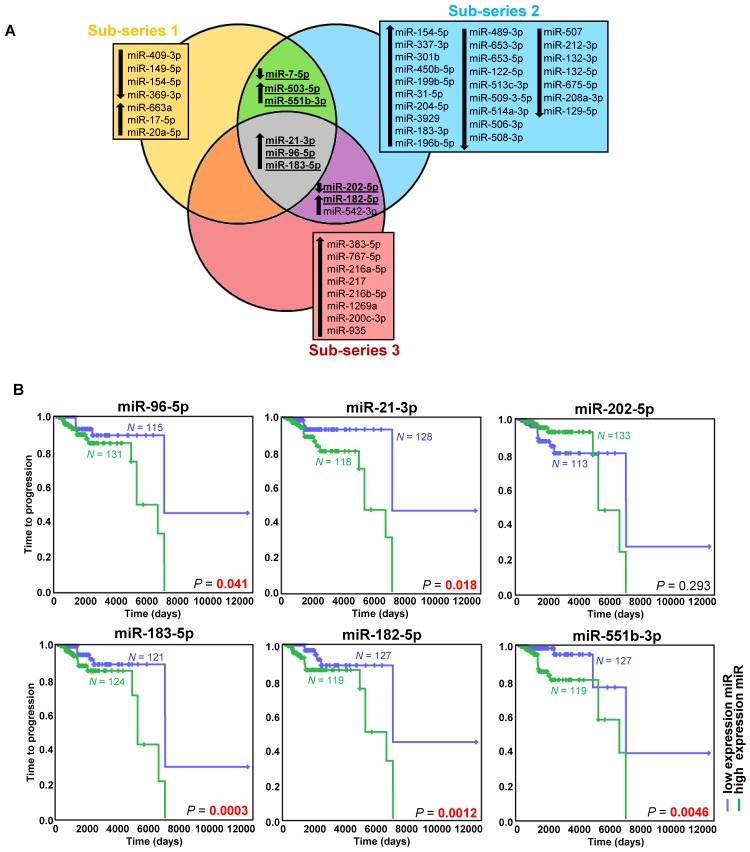
Figure 1.
miRNAs associated with metastatic behavior. (A) Venn diagram of differentially expressed miRNAs (FDR<0.05, |log2 fold change| ≥ 0.75) in the different sub-series of the discovery series (n=443). Downregulated miRNAs are indicated with a downward pointing arrow, and upregulated miRNAs are indicated with an upward pointing arrow. miRNAs selected for validation are shown in bold and are underlined. (B) Kaplan-Meier plots of time to progression (time between the first PPGL diagnosis and the first documented metastases) of patients according to the expression level of the indicated miRNA in tumor tissue. High expression (above the median expression level of the whole group) of the miRNA is represented in blue and low expression (below the median level) in green (n=246 patients from the discovery and validation series, either presenting metachronous metastases ─ presented ≥ one year after diagnosis ─, or with more than one-year follow-up - median follow-up time=1290 days). Patients without evidence of metastases were censored at the date of the last follow-up. P-values were calculated with a log-rank test. N: number of patients.

