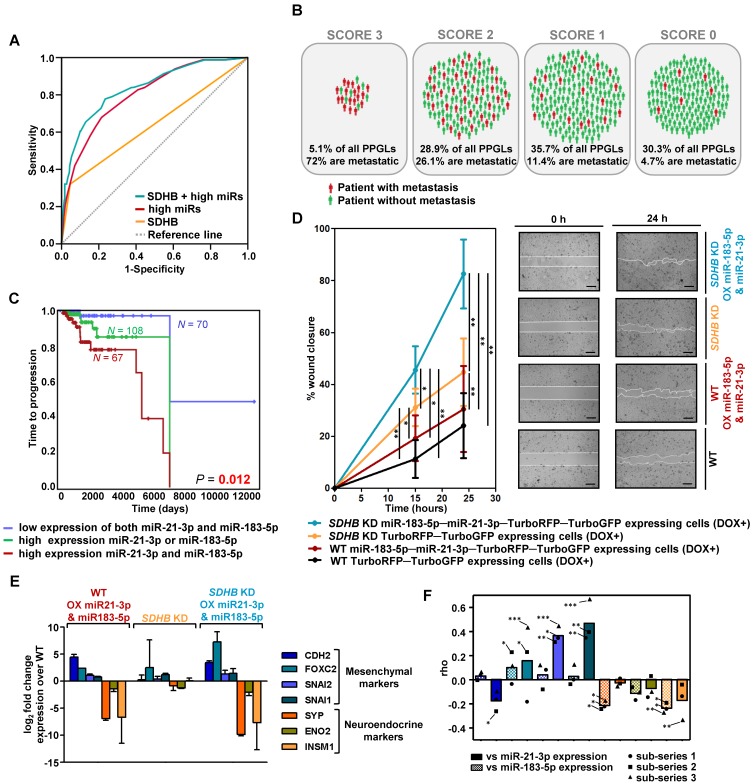
Figure 2.
Risk model of metastasis prediction. (A) Receiver operating characteristic curve analysis showing the accuracy of the miR-SDHB classifier to discriminate mPPGL patients. Data correspond to all samples from the discovery plus the validation series (n=492). miRNAs associated with a shorter TTP were included in the analysis. To combine the data of the different series for the generation of the model, the expression of each miRNA was expressed as a dichotomous variable using the median miRNA expression as the cutoff in each series. Binary variables that identified the different series and the SDHB status were included. AUC, 95%CI and P-values are given in the text. (B) Schematic representation of patients from discovery and validation series (n=492) divided into four groups depending on the miR-SDHB classifier (score 3 = high miR-183-5p and high miR-21-3p and SDHB mutated; score 2 = high miR-21-3p or high miR-183-5p and SDHB mutated, or high miR-21-3p and miR-183-5p and SDHB not mutated; score 1 = high miR-21-3p or high miR-183-5p or SDHB mutated; score 0 = none of the aforementioned criteria apply). Red icons: patients with mPPGL; green icons: non-metastatic patients. (C) Kaplan-Meier plot of TTP of patients according to the expression levels of the miRNAs indicated. High and low expression indicates expression above and below the median expression level of the whole group, respectively. N: number of patients. P-values were calculated with a log-rank test. (D) Wound healing assay in SK-N-AS cells with/without SDHB stably silenced and with/without ectopic expression of miR-21-3p and miR-183-5p. Wound area was assessed at 0, 15 and 24 h. Quantification is based on 18 pictures/condition, n=2. Error bars represent SD.*P<0.05, **P<0.01; two-tailed unpaired t-test. Scale bars=100 µm. (E, F) Expression of the indicated mesenchymal and neuroendocrine genes observed in the SK-N-AS cell model and in the discovery series. (E) Log2 fold change expression of the indicated genes relative to WT TurboRFP-TurboGFP-expressing control cells after normalization of each sample to β-actin. All cells were pretreated with doxycycline (1µg/ml, 120h). Expression is reported as mean of triplicates and error bars represent SD. (F) Spearman's correlations (rho) between the genes shown in Figure (E) and miR-21-3p (smooth columns) or miR-183-5p (dotted columns) expression in the discovery series. Bars indicate the mean of the 3 sub-series; individual values of each sub-series are also shown (•=sub-series 1, ■=sub-series 2, ▲=sub-series 3). ***P<1·10-9, **P<1·10-4, *P<0.05. DOX+: doxycycline pretreated cells (1µg/ml, 120h). WT: wild type; OX: overexpressing; KD: knock down.

