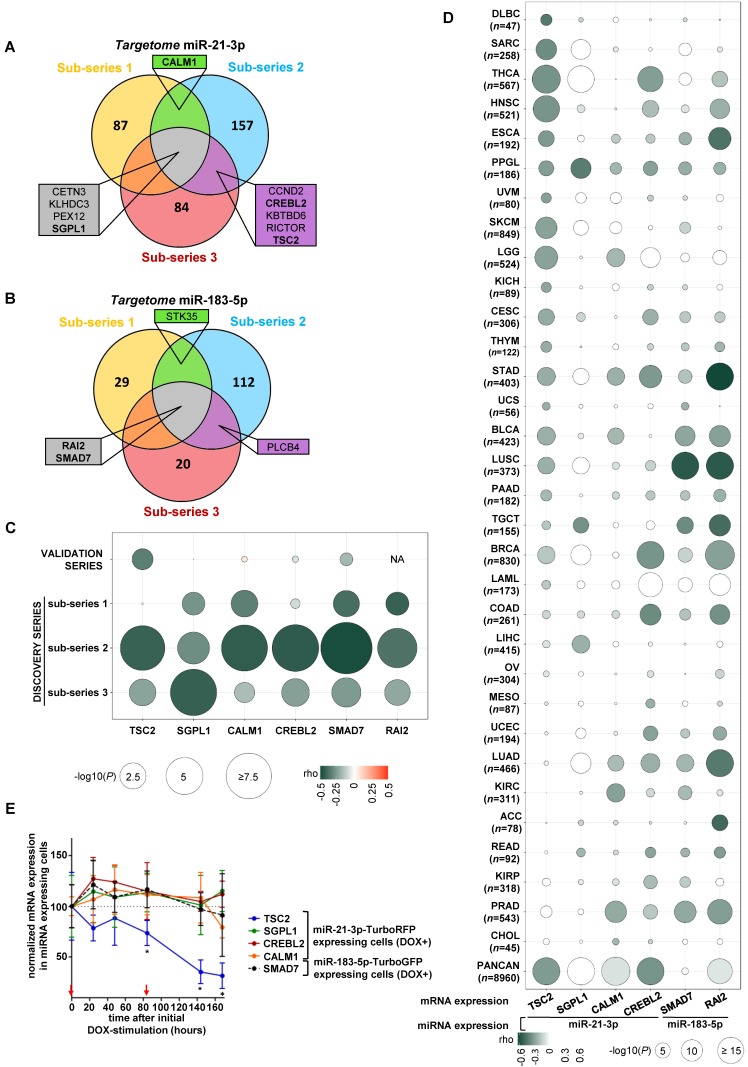
Figure 3.
Identification of potential gene targets of miR-21-3p and miR-183-5p. (A, B) Venn diagrams summarizing significant genes showing a negative correlation (P<0.05) with miR-21-3p and miR-183-5p expression, respectively, in each sub-series of the Discovery series. Only genes shared between at least two sub-series are shown; rho and p-values are shown in Tables S4 and S5. Genes selected for validation are shown in bold. (C) Bubble diagram showing the correlation between mRNA levels of selected target genes in the discovery and validation series; the colors of the bubbles indicate the rho-value and their diameter is proportional to - log10(P) as indicated below the panel. NA: data not available. (D) Bubble diagrams showing the correlations between mRNA expression of the selected target genes and miRNA expression across 32 TCGA projects representing the major cancer types: LAML, acute myeloid leukemia; ACC, adrenocortical carcinoma; BLCA, bladder urothelial carcinoma; LGG, brain lower grade glioma; BRCA, breast invasive carcinoma; CESC, cervical squamous cell carcinoma and endocervical adenocarcinoma; CHOL, cholangiocarcinoma; COAD, colon adenocarcinoma; READ, rectum adenocarcinoma; ESCA, esophageal carcinoma; HNSC, head and neck squamous cell carcinoma; KICH, kidney chromophobe; KIRC, kidney renal clear cell carcinoma; KIRP, kidney renal papillary cell carcinoma; LIHC, liver hepatocellular carcinoma; LUAD, lung adenocarcinoma; LUSC, lung squamous cell carcinoma; DLBC, lymphoid neoplasm diffuse large B-cell lymphoma; MESO, mesothelioma; OV, ovarian serous cystadenocarcinoma; PAAD, pancreatic adenocarcinoma; PCPG, pheochromocytoma and paraganglioma ('PPGL' in our report); PRAD, prostate adenocarcinoma; SARC, sarcoma; SKCM, skin cutaneous melanoma; STAD, stomach adenocarcinoma; TGCT, testicular germ cell tumors; THYM, thymoma; THCA, thyroid carcinoma; UCS, uterine carcinosarcoma; UCEC, uterine corpus endometrial carcinoma; PANCAN: dataset downloaded from UCSC Xena. Glioblastoma multiforme was not included in the study since miRNA expression data was not available in UCSC Xena. n: number of samples per project. Colors and diameters of the bubbles are as in (C) and are summarized at the bottom of the panel. (E) Normalized mRNA expression of genes selected from the targetome in miR-21-3p─TurboRFP expressing cells (TSC2, SGPL1, CREBL1, CALM1) or miR-183- 5p─TurboGFP expressing cells (SMAD7). Expression for each condition is normalized to β-actin and expression in control cells (mean + SD; n=3). We represent the average of WT and SDHB KD cells of the mean-centered expression of the miRNA expressing cells (DOX+) over TurboRFP or TurboGFP expressing control cells (DOX+), respectively after initial doxycycline stimulation (1µg/ml) at t0. Two-tailed unpaired t-test was applied to test for differences with control cells not overexpressing miRNA (*: P<0.05). Red arrows indicate medium changes (DOX-stimulation).

