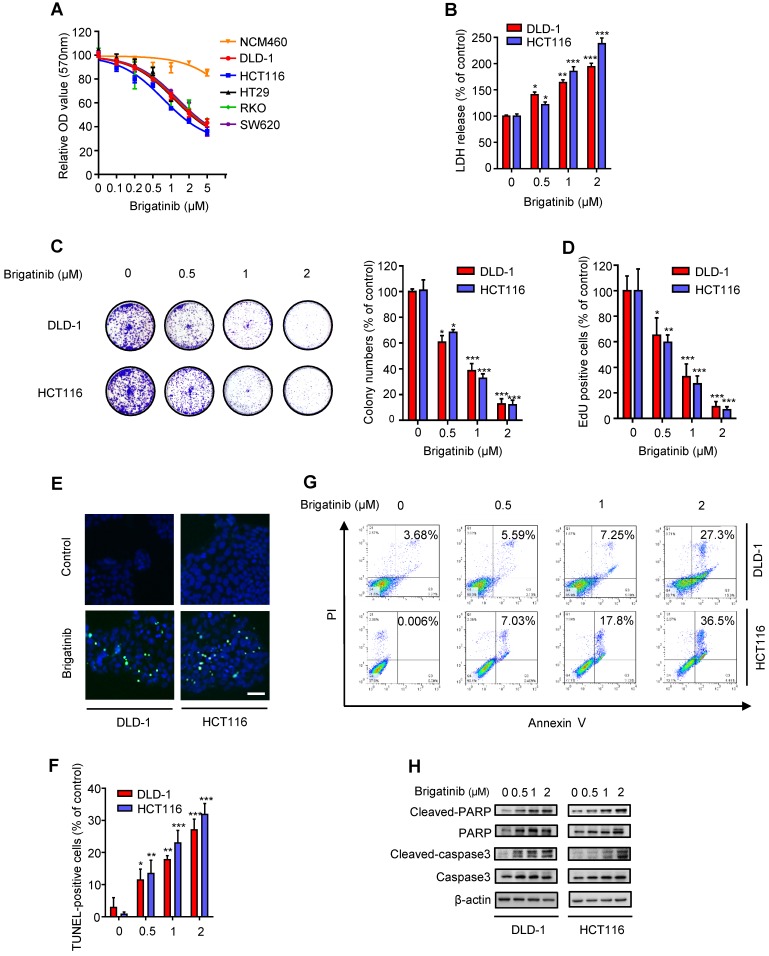
Figure 1.
Brigatinib inhibits the growth of CRC cells. A, Cell growth of various CRC cell lines treated with the indicated concentrations of brigatinib for 24 hours. B, LDH release assay of DLD-1 and HCT116 cells treated with the indicated concentrations of brigatinib for 24 hours. *, P < 0.05; **, P < 0.01; ***, P < 0.001. C, Colony formation assay of CRC cells treated with the indicated concentrations of brigatinib. Representative images (Left) and quantification of colonies (Right) were shown. *, P < 0.05; ***, P < 0.001. D, EdU labeling assay. Cells were treated as in (B). *, P < 0.05; **, P < 0.01; ***, P < 0.001. E-F, TUNEL assay in cells treated as in (B). Representative images (E) and quantification of TUNEL-positive cells (F) were shown. Scale bar, 50 μm. *, P < 0.05; **, P < 0.01; ***, P < 0.001. G, Flow cytometric analysis of apoptosis in cells treated as in (B). H, Immunoblotting of total and cleaved PARP or caspase 3 in CRC cells treated with the indicated concentrations of brigatinib for 24 hours.

