Figure 6.
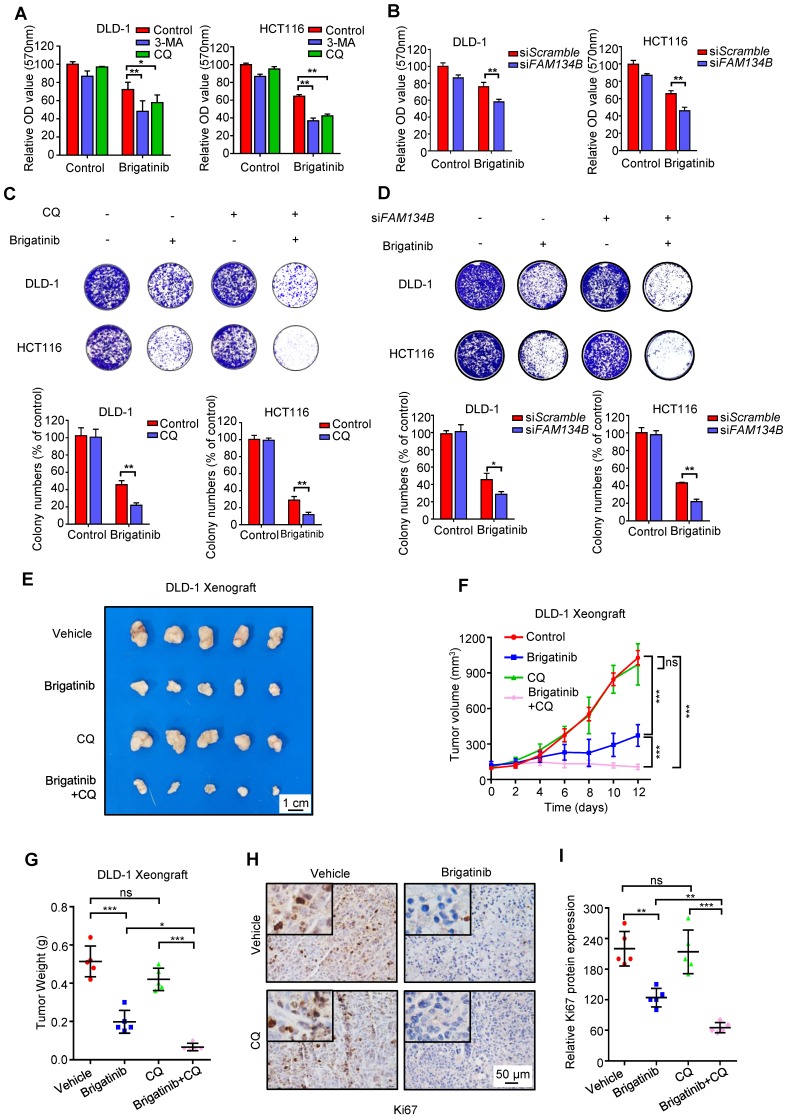
Inhibition of ER-phagy enhances brigatinib susceptibility to CRC cells in vitro and in vivo. A, Cell growth of CRC cells treated with or without 1 μM brigatinib in the presence or absence of 1 mM 3-MA or 10 μM CQ for 24 hours. *, P < 0.05; **, P < 0.01. B, Cell growth of CRC cells transfected with siFAM134B or siScramble followed by treatment with or without 1 μM brigatinib for 24 hours. **, P < 0.01. C, Colony formation assay of CRC cells treated with or without 1 μM brigatinib in the presence or absence of 10 μM CQ. Representative images (Top) and quantification of colonies (Bottom) were shown. **, P < 0.01. D, Colony formation assay of CRC cells transfected with siFAM134B or siScramble followed by treatment with or without 1 μM brigatinib. Representative images (Top) and quantification of colonies (Bottom) were shown. *, P < 0.05; **, P < 0.01. E-G, DLD-1 cells were injected subcutaneously into nude mice. When the tumor volumes reached ~100 mm3, mice were received vehicle or brigatinib in combination with or without CQ. Images (E) and weights (G) of isolated tumors and volumes measured at the indicated time points (F) were shown. Scale bar, 1 cm. ns, no statistical significance; *, P < 0.05; ***, P < 0.001. H-I, Immunohistochemical staining of Ki67 (H) and relative immunohistochemical scores (I) were shown. Scale bar, 50 μm. ns, no statistical significance; **, P < 0.01; ***, P < 0.001.

