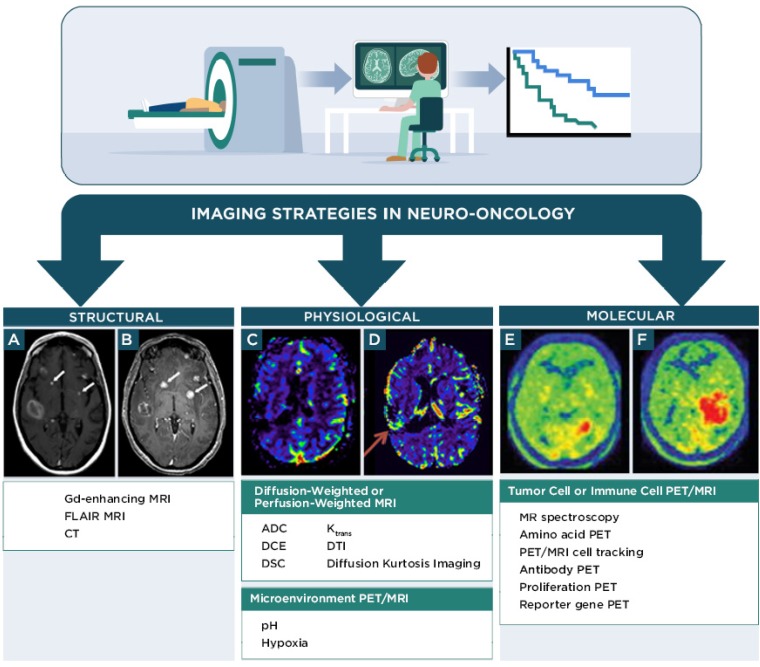
Figure 1.
Overview of imaging techniques used to predict response to immunotherapy in neuro-oncology research. A, B: gadolinium-enhanced T1 MRI images in a patient with melanoma brain metastases before (A) and 11 days after (B) treatment with pembrolizumab checkpoint immunotherapy. Arrows indicate resected lesions, which showed inflammatory cell responses attributed to treatment effects rather than disease progression. (Adapted with permission from 46 copyright 2015 American Association for Cancer Research) C,D: Perfusion weighted MRI images of relative cerebral blood volume in a patient with relapsed malignant glioma at 1.5 months (C) and 10.5 months (D) after treatment with dendritic cell vaccine immunotherapy. The arrow in D indicates increased relative cerebral blood volume in the region of the tumor attributed to progressive disease at the latter time point. (Adapted with permission from 47 copyright 2010 Springer Nature) E,F: [11C]MET amino acid PET images in a patient with recurrent GBM before (E) and 12 weeks after (F) treatment with WT1 peptide vaccine immunotherapy. Increased PET signal (red) is attributed to disease progression. (Adapted with permission from 48 copyright 2012 American Association of Neurological Surgeons) DCE, dynamic contrast-enhanced MRI; Ktrans, rate of transfer from plasma to extravascular space in perfusion MRI; DSC, dynamic susceptibility-weighted contrast-enhanced MRI; ADC, apparent diffusion coefficient in diffusion MRI; DTI, diffusion tensor imaging MRI; DKI, diffusion kurtosis imaging MRI.

