Figure 3.
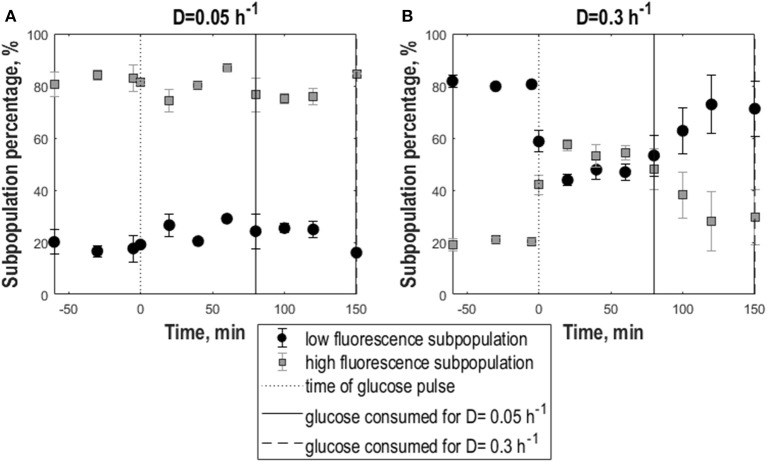
Subpopulation distribution dynamics following glucose perturbation for yeast cells as a consequences to exposure to freeze-thaw treatment. Percentage of low-fluorescence (circles, black) and high-fluorescence (squares, gray) subpopulations vs. time following a 1 g.L−1 glucose pulse of S. cerevisiae FE440 in aerobic, glucose-limited chemostat cultures frozen after growth at D = 0.05 h−1 (A) or D = 0.3 h−1 (B). The black dotted line indicates the time of the glucose pulse. Full, respectively, dotted vertical lines correspond to the time when pulsed glucose was consumed for the cultures grown at D = 0.3 h−1 (dotted vertical line) and D = 0.05 h−1 (full vertical line). Vertical error bars indicate biological triplicates.

