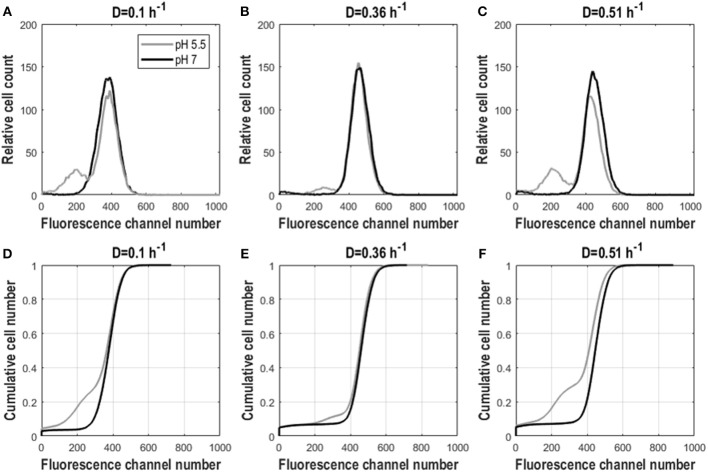
Figure 4.
Fluorescence distributions for frozen E. coli cells in steady-state aerobic glucose-limited chemostats analyzed at pH 5.5 and 7. Cell count against fluorescence channel number (A–C) and cdfplots of cumulative cell number against fluorescence channel number (D–F) for D = 0.1 h−1, D = 0.36 h−1, and D = 0.51 h−1 for frozen E. coli cells analyzed at pH 5.5 (gray) and 7 (black). Plots show averaged values from three different residence times originating from biological triplicates.

