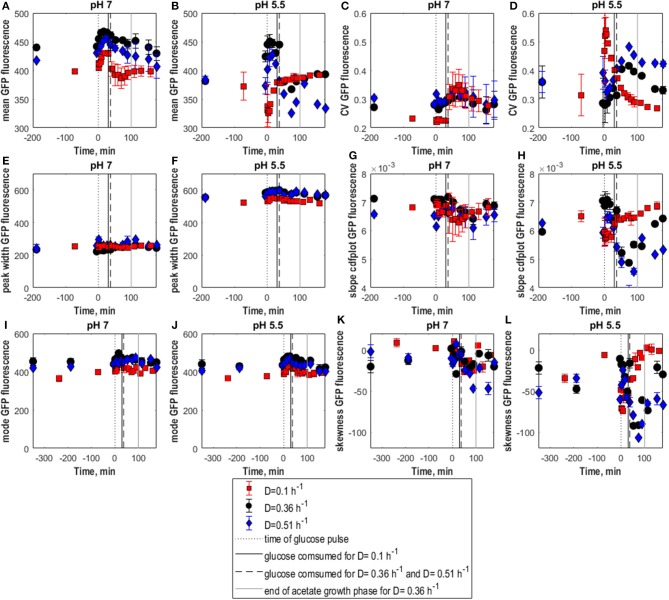
Figure 5.
Population heterogeneity of E. coli following glucose perturbation analyzed at pH 5.5 and 7. Mean GFP fluorescence (A,B), CV of GFP fluorescence (C,D), peak width (E,F), and cdfplot slope (G,H), mode of GFP fluorescence (I,J), skewness of GFP fluorescence (K,L) vs. time following a 0.45 g.L−1 glucose pulse for E. coli in aerobic glucose-limited chemostat cultures at D = 0.1 h−1 (squares), 0.36 h−1 (circles), 0.51 h−1 (diamonds) for cells analyzed at pH 7 (A,C,E,G,I,K) and 5.5 (B,D,F,H,J,L). Black dotted line, time of glucose pulse. Full, respectively, dashed vertical lines, correspond to the time when pulsed glucose was consumed under the indicated culture conditions. A gray vertical line indicates the end of the acetate growth phase. Vertical error bars indicate biological triplicates.

