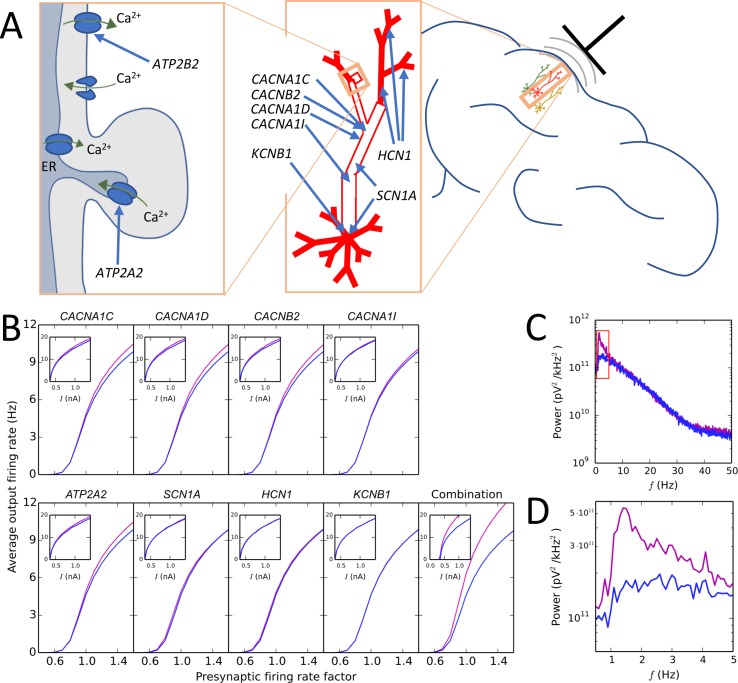
Figure 2.
Illustration of a modelling approach predicting that a combination of small-effect variants in different schizophrenia-associated ion channel- and Ca2+ transporter-encoding genes causes large effects on the delta band in the EEG power spectrum. (A) Schematic illustration of the subcellular domain (left) of a layer V pyramidal cell (middle) and the localization of the neuron with respect to a recording electrode (right). Genes ATP2A2 and ATP2B2 contribute to the Ca2+ dynamics of the neuron: ATP2A2 encodes a subunit of the sarco/endoplasmic reticulum Ca2+-ATPase (SERCA) that pumps cytosolic Ca2+ into the endoplasmic reticulum (ER), and ATP2B2 encodes a subunit of the plasma membrane Ca2+ ATPase (PMCA) that expels cytosolic Ca2+ to the extracellular medium. Genes CACNA1C, CACNA1D, and CACNB2 encode subunits of high-voltage activated Ca2+ channels, and CACNA1I encodes a low-voltage activated Ca2+ channel: these channels are densely expressed in the “hot zone” of Ca2+ channels at the apical dendrite, but they are present in the soma as well (68). SCN1A encodes a subunit of the fast voltage-gated Na+ channel that is densely expressed in the soma and mildly expressed in the apical dendrite (68). Finally, KCNB1 encodes a subunit of a voltage-gated K+ channel that is only present in the soma, and HCN1 encodes a subunit of a non-specific cationic channel whose density grows toward the end of the apical dendrite (68). (B) Effects of model variants of schizophrenia-associated ion channel- and Ca2+ transporter-encoding genes on firing rates of layer V pyramidal neurons as part of a network (main curves) and in isolation (insets). In the network experiments, interconnected networks of 150 neurons were simulated for 11 s so that the rate of presynaptic inputs (AMPA, NMDA, and GABA receptor-mediated currents) was controlled by factor (shown on x-axis), which influenced the average firing rate of the neurons in the network (shown on y-axis). In the single-cell experiments, a prolonged somatic square-pulse current (amplitude shown on x-axis) was given at the soma, affecting the firing frequency (shown on y-axis). The blue curves show the control network/neuron, while the purple curves show the network/neuron with the model variant. The fifth subpanel in the bottom row shows the effects of combination of the eight variants. For network simulations, reduced-morphology representations (48) of the layer V pyramidal cells were used to avoid excessive simulation load. Adapted from Mäki-Marttunen et al. (93). (C) Power spectrum of the EEG signal predicted from the activity of the network corresponding to presynaptic rate factor 1.0 in control and variant-combination conditions of panel (B). To obtain this signal, transmembrane currents were registered at each compartment of each cell, and these currents were used to calculate the dipole moment time series of the cell population. From the dipole moments, the EEG signal was estimated using a theoretical model of Næss et al. (153), implemented in the LFPy Python package (141). Consistent with the predictions of panel (B), the EEG power is increased for the combination of model variants compared with the control network, especially in the delta (0.5–5 Hz) range. Adapted from Mäki-Marttunen et al. (93). (D) Zoomed-in view on the red rectangle of panel (B).

