
Figure 4. CHROME interacts with a set of miRNAs known to repress cholesterol efflux.
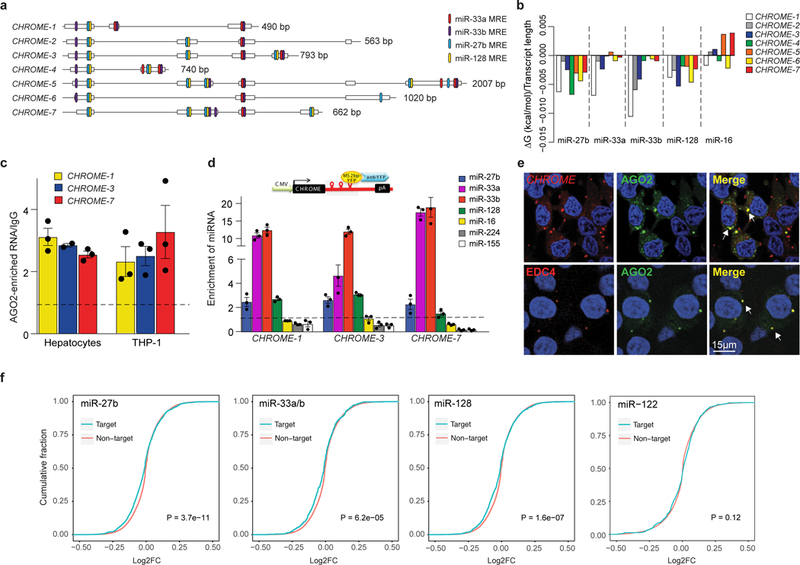
a,Schematic diagram showing multiple miRNA response elements (MRE) for miR-27b, miR-33a, miR-33b and miR-128 in CHROME variants. b, RNAcofold-predicted changes in Gibbs free energy (ΔG) upon binding of CHROME variants to miR-27b, miR-33a, miR-33b, miR-128 or miR-16 (control). c, Enrichment of CHROME RNA in AGO2-immunoprecipitates from primary human hepatocytes and THP-1 macrophages relative to IgG control. d, qPCR detection of miRNAs in CHROME-1, CHROME-3 and CHROME-7 ribonucleoprotein complexes precipitated using MS2-tagged RNA affinity purification (MS2-TRAP). Data are normalized to U6 and control MS2-bs-vector. c-d) Data are the mean ± SEM of a single experiment and are representative of 3 independent experiments. e, Fluorescence in situ hybridization for CHROME (red: top) and immunostaining for the P-body marker EDC4 (red: bottom) in HEK293T cells expressing AGO2-GFP (green) and stained with DAPI nuclear stain (blue). Arrows in merged image indicate signal colocalization (yellow) in punctate structures. Staining is representative of 2 independent experiments. f, Cumulative distribution plots of log2-transformed gene expression fold changes from RNA-Seq of CHROME-shRNA vs control-shRNA HepG2 cells (3 biological replicates each), showing genes containing miR-27b, miR-33a/miR-33b or miR-128 target sites predicted by Targetscan (blue) and all other expressed genes (red). As a control, similar analyses were performed for genes containing target sites of miR-122, a hepatic miRNA with known roles in lipid metabolism. The increased prevalence of negative log2-fold changes among predicted targets of miR-27b, miR-33 and miR-128 (left shift of blue line compared to red), but not miR-122, suggests increased inhibitory effects of those miRNAs upon CHROME knockdown. P-values were calculated a two-sample Kolmogorov-Smirnov test.