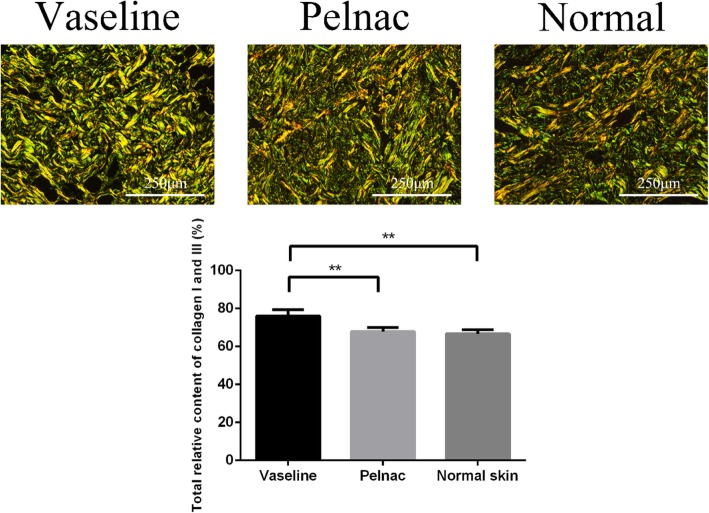
Fig. 7.
Total relative collagen Ι and III content in Vaseline gauze and Pelnac groups on day 35 post-operation. Data are representative of day 35 and are compared to normal skin. (Top) collagen I and III was detected by Picrosirius red staining (× 200). Scale bars, 250 μm. (Bottom) statistical analysis of total relative collagen Ι and III content. Vaseline gauze group 76.06 ± 3.0%, Pelnac group 67.78 ± 2.0%, normal skin 66.65 ± 2.1%. Data are presented as mean ± standard deviation. Error bars indicate standard deviation. Statistical analysis was performed by one-way ANOVA. *p < 0.05, **p < 0.01

