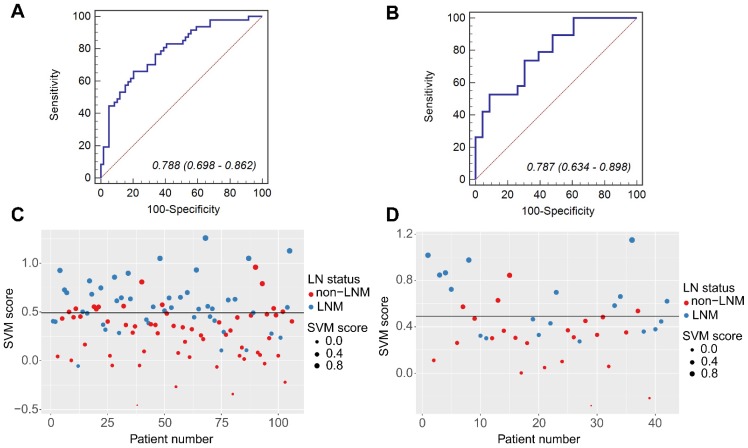
Figure 2.
The ROC curves of the SVM model in the training group (A) and the validation group (B). The scatter plots of the SVM scores in the training group (C) and the validation group (D). The blue markers indicate patients with synchronous LNM; the red markers indicate patients with non-LNM. The black horizontal line presents the threshold. Patients with SVM scores higher than 0. 4915 are classified as LNM; patients with scores lower than 0. 4915 are classified as non-LNM.

