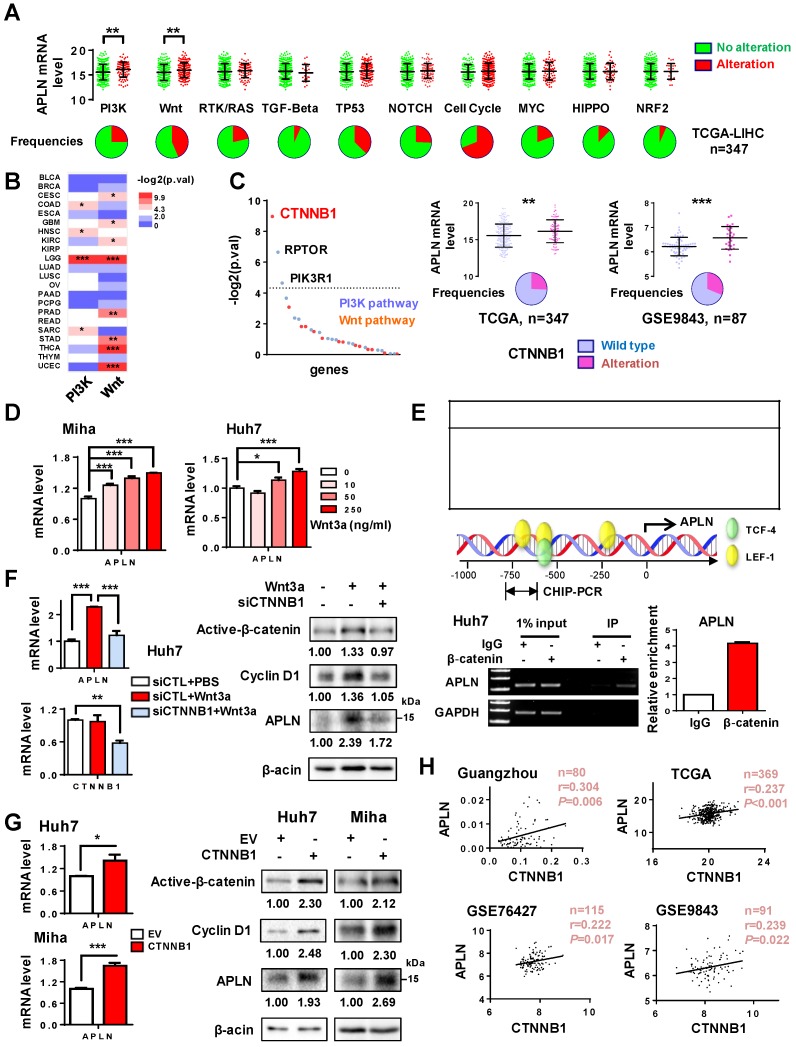
Figure 2.
APLN is a downstream target of WNT/β-catenin signaling. (A) Alteration frequencies of ten canonical pathways (cell cycle, Hippo, Myc, Notch, Nrf2, PI3K/Akt, RTK-RAS, TGF-β signaling, p53 and Wnt/β-catenin) in TCGA-LIHC cohort were displayed in pie charts. Student's t-test was performed. (B) Comparison of APLN expression between tumors with alteration in PI3K/Akt (or Wnt/β-catenin) pathway and those without. Full name of cancer-type abbreviations were provided in Table S1. The p values were obtained by Student's t-test and shown as heatmap. (C) In TCGA-LIHC cohort, correlations of APLN expression with individual gene alteration from PI3K/Akt and Wnt/β-catenin pathway were assessed and showed in left panel. Right panel demonstrated that HCC tissues carrying mutant β-catenin exhibited higher APLN expression as compared to those with wild type in both TCGA and GSE9843 cohorts. Student's t-test was performed. (D) Treatment of Miha and Huh7 cells with recombinant human Wnt3a protein for 24h promoted the transcription of APLN in a dose-dependent manner. (E) Top panel showed in silico promoter prediction, which identified binding sites for TCF-4/LEF-1 in promoter region (-1kb to +100bp) of APLN. Middle panel indicated predicted binding sites for TCF-4/LEF-1 (PROMO), and the promoter regions analyzed by ChIP-PCR. Bottom panel revealed the interaction of β-catenin with APLN promoter by chromatin-immunoprecipitation PCR and qPCR analysis. (F) Wnt3a-induced APLN expression was blocked by β-catenin knockdown both at mRNA (left panel) and protein (right panel) level in Huh7 cell. (G) Transient transfection of constitutively active β-catenin (S33Y) promoted mRNA (left panel) and protein (right panel) expression of APLN both in Huh7 and Miha cells. (H) CTNNB1mRNA expression is positively correlated with APLN mRNA expression in Guangzhou, TCGA, GSE76427, and GSE9843 cohorts. Error bars in D-G represent means ± sd from three independent experiments, (* P < 0.05, ** P < 0.01, *** P < 0.001).

