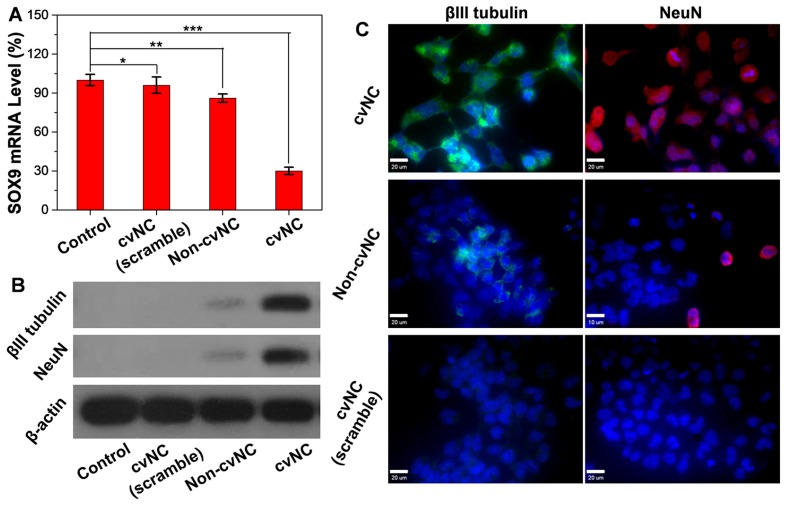
Figure 2.
Intracellular activity of cvNCs in the NSCs. (A) qRT-PCR analyses of SOX9 mRNA expression and (B) western blot analyses of βIII tubulin and NeuN expression in NSCs treated with cvNC or controls for 8 days. Student's t test, *: P > 0.41, **: P < 0.013, ***: P = 0.000018. (C) Immunofluorescence staining of βIII tubulin (green) and NeuN (red) in NSCs treated with cvNC without reporters or control cvNCs at day 8. Scale bar: 20 µm.

