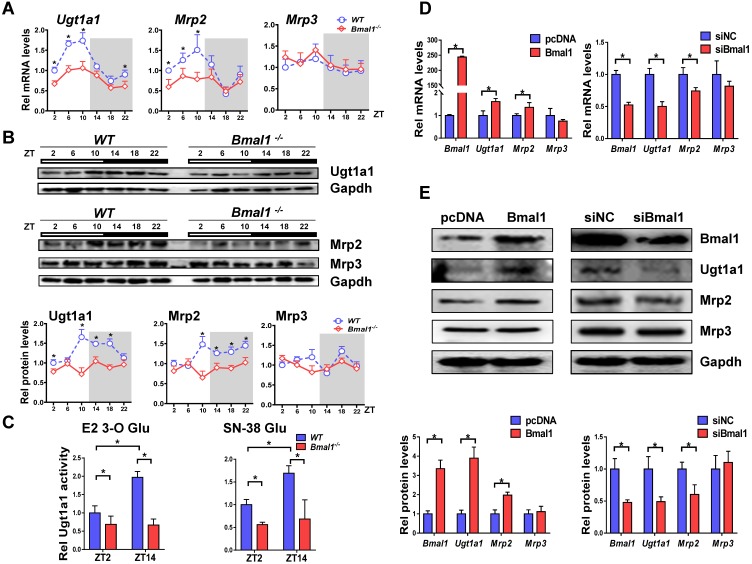
Figure 3.
Bmal1 regulates Ugt1a1 and Mrp2 expression. (A) Rhythmic mRNA levels of Ugt1a1, Mrp2 and Mrp3 in the livers of WT and Bmal1-/- mice measured by qPCR. Data are mean ± SD (n=5). *P < 0.05 for two group comparisons at individual time points (post hoc Bonferroni test). (B) Rhythmic protein levels of Ugt1a1, Mrp2 and Mrp3 in the livers of WT and Bmal1-/- mice measured by Western blotting (top panel). The quantification data of Ugt1a1, Mrp2 and Mrp3 proteins bands (bottom panel). Data are mean ± SD (n=5). Statistical differences between blot density levels were analyzed by post hoc Bonferroni test. *P < 0.05 for two group comparisons at individual time points. (C) Liver microsomal metabolism assay showing decreased Ugt1a1 activity in livers of Bmal1-/- mice at ZT2 and ZT14. Data are mean ± SD (n=5). *P < 0.05 (post hoc Bonferroni test). (D) qPCR measurements of mRNA expressions for Bmal1, Ugt1a1, Mrp2 and Mrp3 in Hepa1-6 cells. Cells were transfected with Bmal1 overexpression plasmid or siRNA of Bmal1/negative control. (E) Bmal1, Ugt1a1, Mrp2 and Mrp3 protein expressions measured by Western blotting in Hepa1-6 cells transfected with Bmal1 overexpression plasmid or siRNA of Bmal1/negative control (top panel). The quantification data of Bmal1, Ugt1a1, Mrp2 and Mrp3 proteins bands (bottom panel). In panel D&E, data are mean ± SD (n=5). *P < 0.05 (t test).

