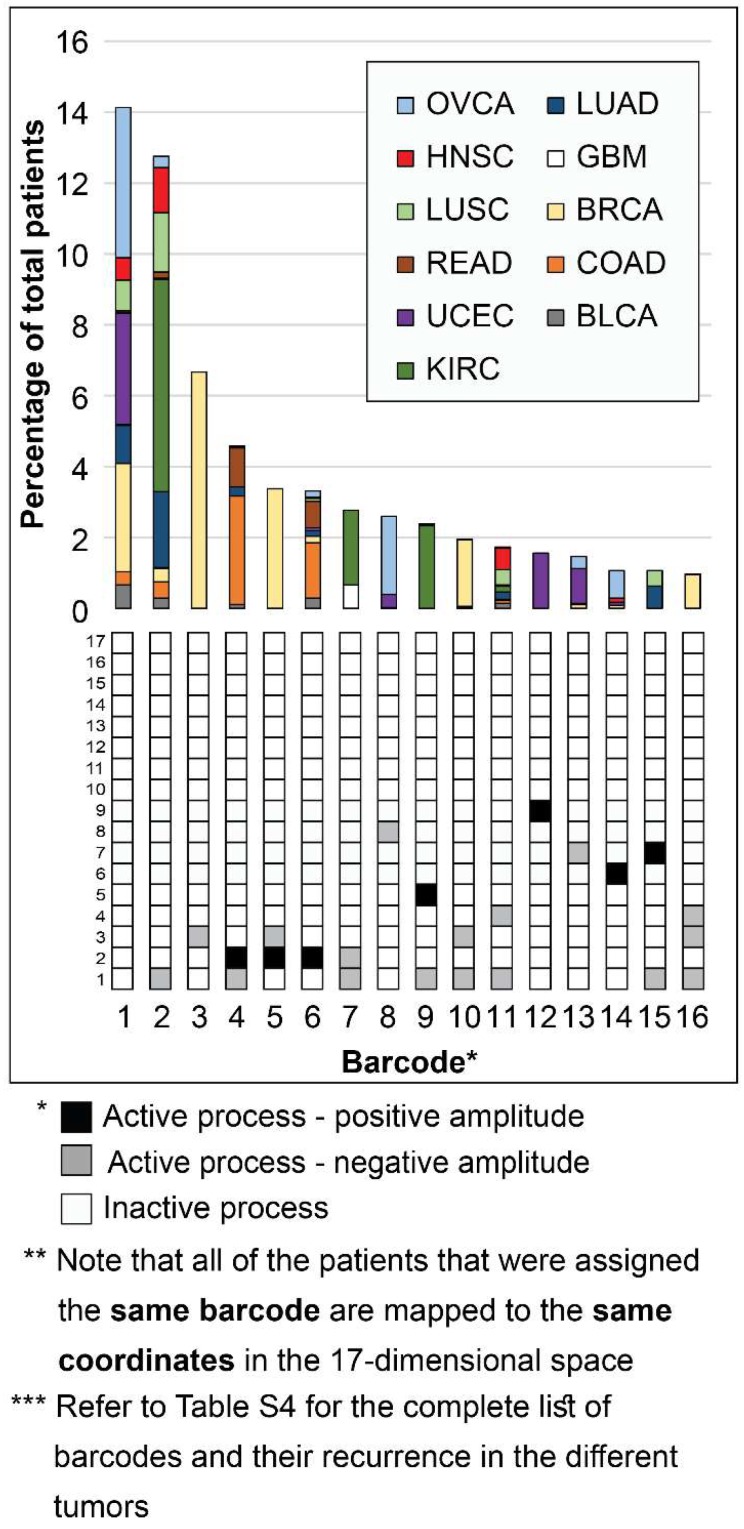
Figure 3.
Mapping the patients into a 17-dimensional data space. Mapping the patients into a data space, where each dimension is represented by a specific unbalanced process, enables to accurately describe every individual tumor. The 16 most abundant barcodes are shown, each appearing in 1% or more of the patients (at least 35 patients). Each tumor-specific barcode we identified is mapped to specific coordinates in the 17-dimensional space, according to the active unbalanced processes and the sign of their amplitude. The graph presents a two-dimensional form of this concept - each column in the graph represents multiple patients that were mapped to the same coordinates in the 17-dimensional space. The complete information derived using surprisal analysis of the 3467 tumors can be mapped using 452 distinct barcodes (see Table S4), which are mapped to 452 different coordinates in the 17-dimensional space. Note: Active unbalanced processes are such that were assigned a significant amplitude (normalized to 1 or -1, marked black or gray, respectively), whereas inactive unbalanced processes are such that were assigned an insignificant amplitude (normalized to 0 and marked white).

