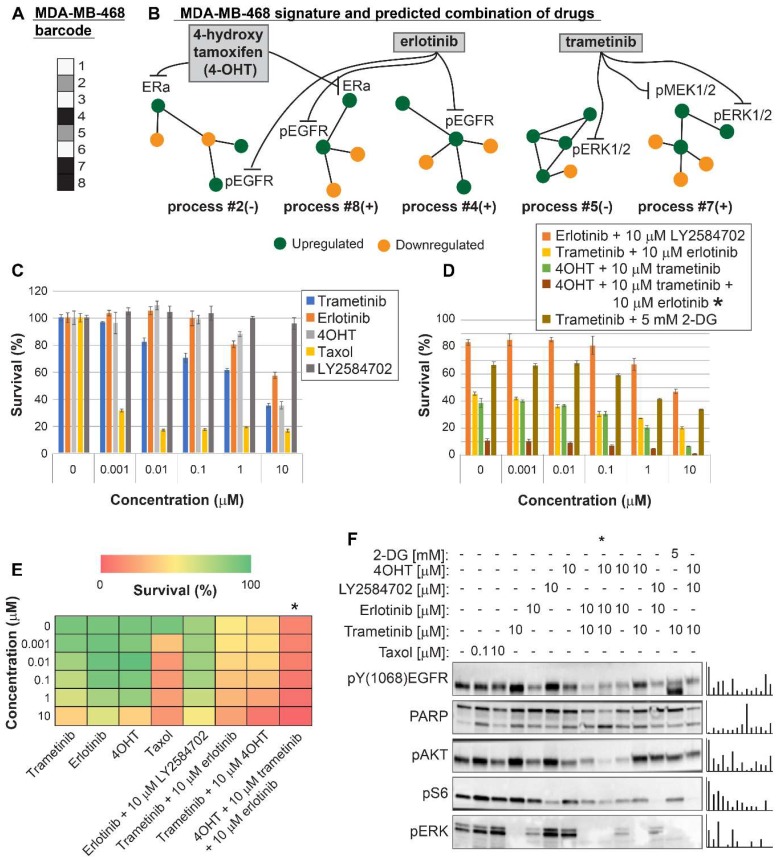
Figure 5.
Surprisal analysis predicts efficient drug combinations for MDA-MB-468 TNBC cell line. (A,B) The barcode of unbalanced processes and the emerging altered signaling signature of MDA-MB-468 cells, according to SA. Schematic figures of each unbalanced process are shown, including the sign of the amplitude in the specific cell line ((-) or (+)). Accordingly, the upregulation or downregulation of every protein is indicated in green or yellow, respectively. Note that in specific samples the directions of change may be opposite, see SI for more details. The complete subnetworks are presented in Figure S8. Drug combination prediction is indicated. (C,D,E) Survival rates in response to different treatments. The combination of drugs predicted to target the complete unbalanced signaling signature was tested (marked with an asterix), as well as combinations that were predicted to only partially target the unbalanced signaling flux, each drug alone and taxol. The combination predicted to target MDA-MB-231 was tested (trametinib + 2-DG), showing significantly lower efficacy against MDA-MB-468 cells. The results are also shown in heatmap form for improved clarity. (F) Western blot analysis of the cells following different treatments. Our predicted drug combination induced high levels of PARP cleavage relative to other treatments. All results were normalized to total lane intensity obtained by stain-free imaging (Bio-Rad). The column graphs present the normalized results.

