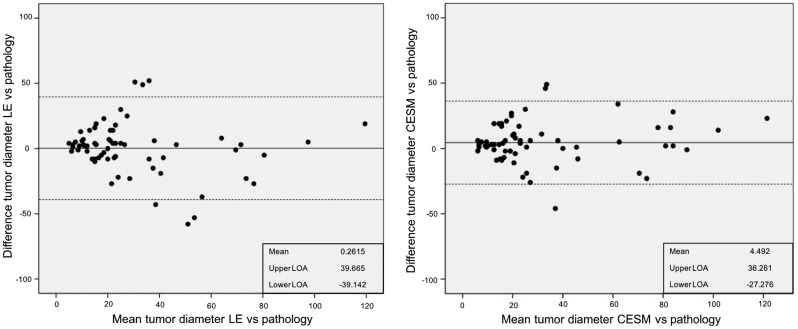
Fig. 2.
Bland–Altman plots visualizing the discrepancies between maximum tumor size measurements according to histopathological examination (gold standard) and maximum tumor size measurements on imaging. The left panel shows results for LE images and the right panel the discrepancies for the entire CESM exam. Also presented are the mean discrepancy (in mm) with histopathological measurements and the upper and lower 95% LOA.

