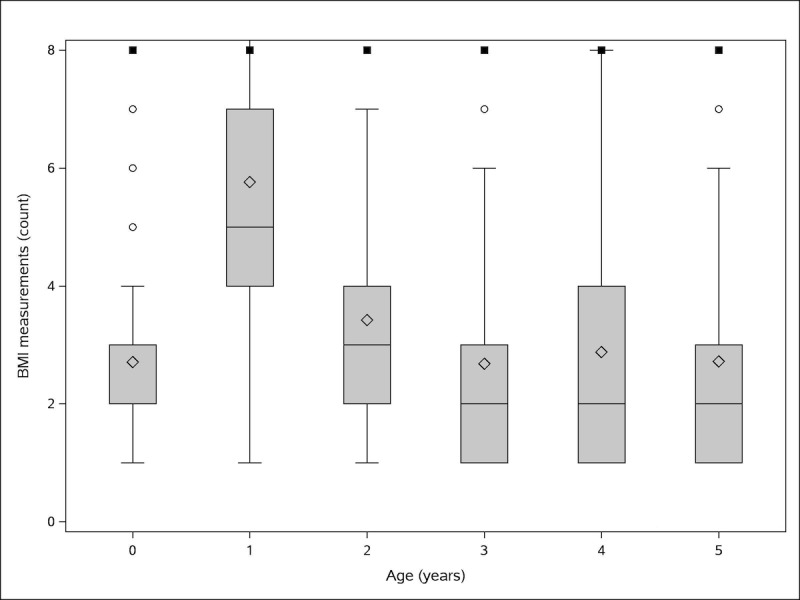
Figure 3.

Box-and-whisker plot of frequency of body mass index measures per child by age (Age 0 includes the neonatal period defined as the first 28 days of life. Plot boxes reflect the interquartile range (IQR; 25th and 75th percentile) as box limits, median (blue line), and mean (blue diamond). Whiskers reflect the minimum and maximum within 1.5 x IQR. Outliers (black circles) were cut at a maximum of 8 measurements). BMI: body mass index.
