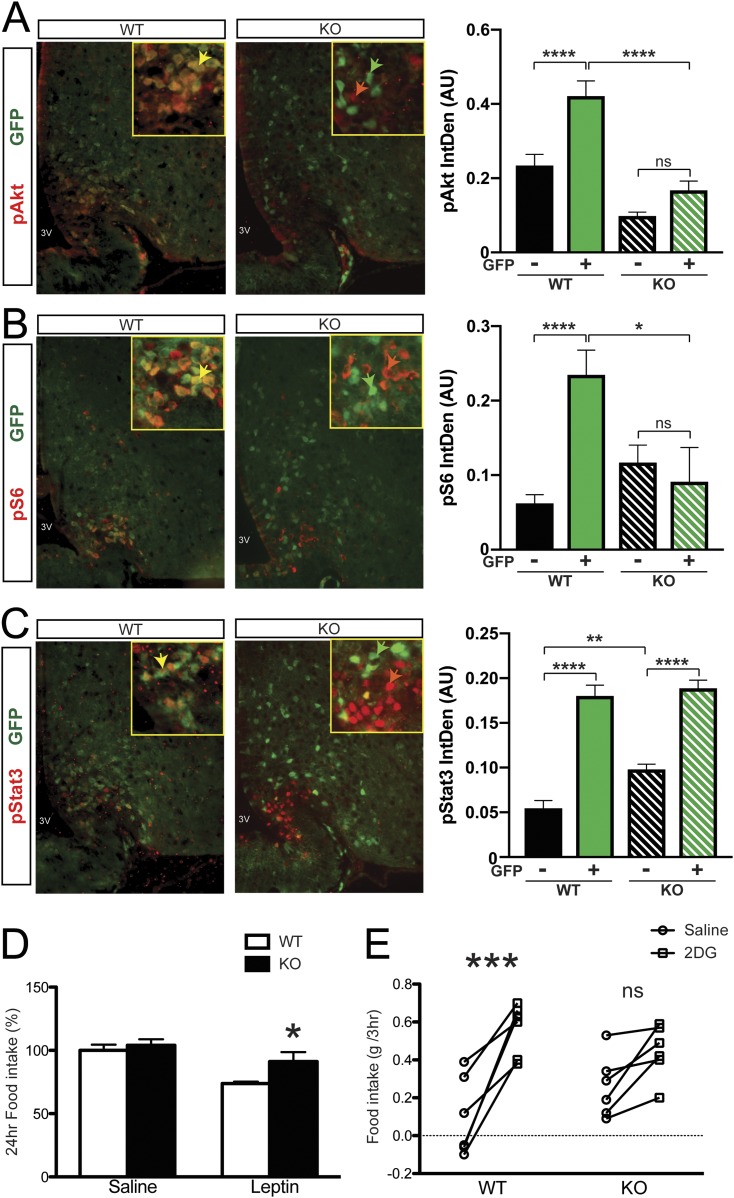
Figure 5.
Hormone and nutrient signaling in Glut4 neurons from GIRKO mice. (A‒C) Immunohistochemistry with (A) pAkt, (B) pS6, and (C) pStat3 and GFP in the ARC of WT and GIRKO mice. Yellow arrowheads point to representative Glut4 neurons in WT mice with positive phosphorylated signaling molecule staining. Green arrowheads point to representative Glut4 neurons in GIRKO mice without positive phosphorylated signaling molecule staining. Red arrowheads point to representative non-Glut4 neurons in GIRKO mice with positive phosphorylated signaling molecule staining. For bar graphs, Glut4 neurons marked by GFP positive staining are labeled with "+"; non-Glut4 neurons lacking GFP staining are labeled with "–". Following refeeding, integrated density of the fluorescent signal in Glut4− (black bars) and Glut+ (green bars) neurons was measured and plotted on the right. Data show means ± SEM (n = 21 to 138 cells measured per group). *P < 0.05; **P < 0.01; ****P < 0.0001; one-way ANOVA/Tukey multiple-comparisons test. (D) Twenty-four‒hour food intake after leptin injection is shown. Data show means ± SEM (n = 7). *P < 0.05; two-way ANOVA/Bonferroni multiple-comparisons. (E) Food intake measurement after saline or 2-DG ip injection is shown. Data show means ± SEM (n = 6). ***P < 0.001; two-way ANOVA/Bonferroni multiple-comparisons. IntDen, integrated density; ns, not significant.

