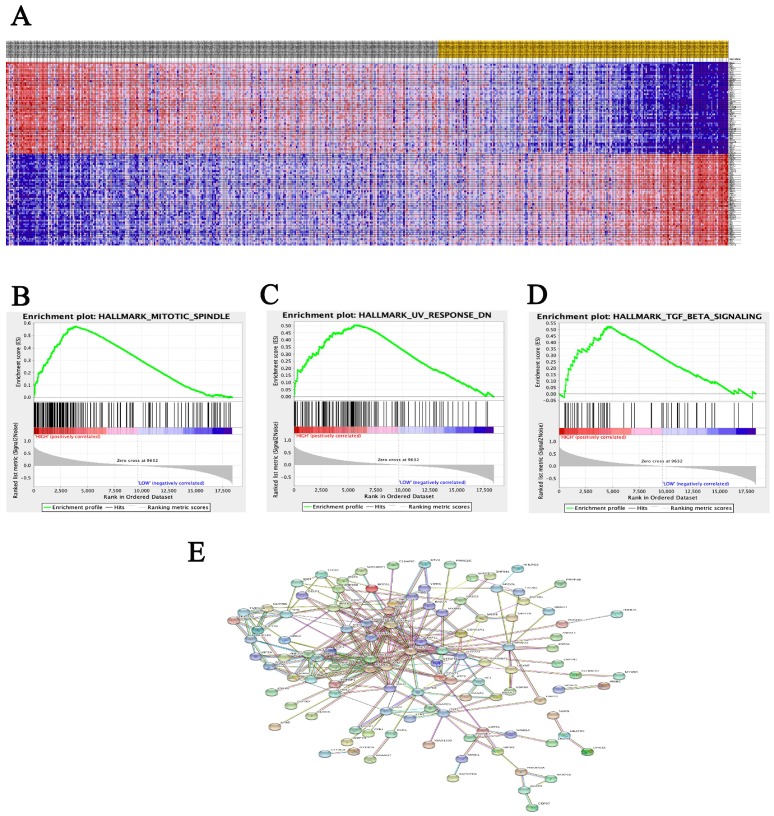
Figure 3.
Datasets from TCGA database were implemented with GSEA method. For each separate analysis, Student's-t-test statistical score was performed in consistent pathways and the mean of the differential expression genes was calculated. A permutation test with 1000 times was used to identify the significantly changed pathways. The adjusted P values (adj. P) using Benjamini and Hochberg (BH) false discovery rate (FDR) method by default were applied to correct for the occurrence of false positive results. The significant related genes were defined with an adj. P less than 0.01 and a FDR less than 0.25.

