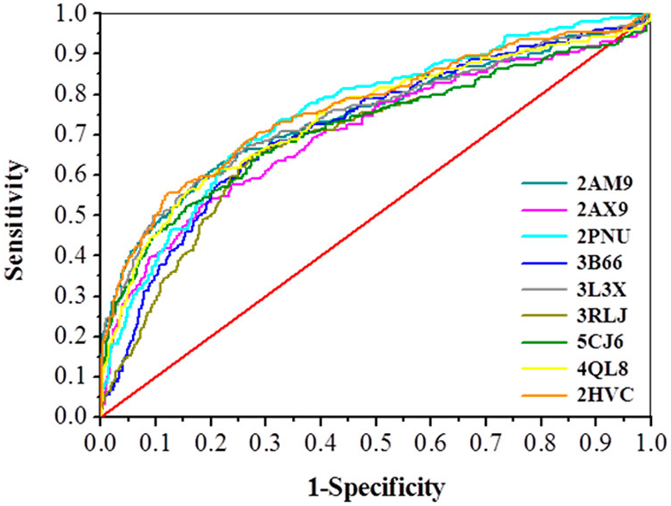
Figure 1.

Receiver operating characteristic (ROC) curves derived from the nine selected AR structures (PDB IDs: 2AM9, 2AX9, 2PNU, 3B66, 3L3X, 3RLJ, 5CJ6, 4QL8 and 2HVC). Each classification model is named as the PDB code of the crystal structure employed to perform docking simulations. Red line: AUC = 0.50; black line: AUC = 1.0. All ROC-curves are colored as defined in the legend.
