
Figure 3.
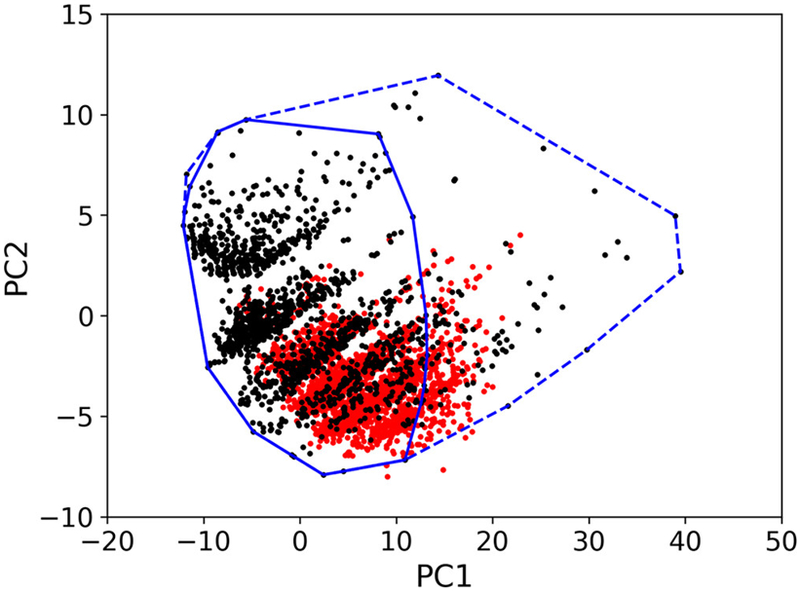
The projection of both EPA-ARDB and VS1 into the top two PCs obtained from the 162 descriptors computed for each compound of the EPA-ARDB. The outer polygon (dashed line) takes into accounts all the chemicals in the EPA-ARDB (black circles), while the inner polygon (solid line) retains the 95% of them. Chemicals of the VS1 (red circles) outside the inner 95% polygon are flagged as outside AD.