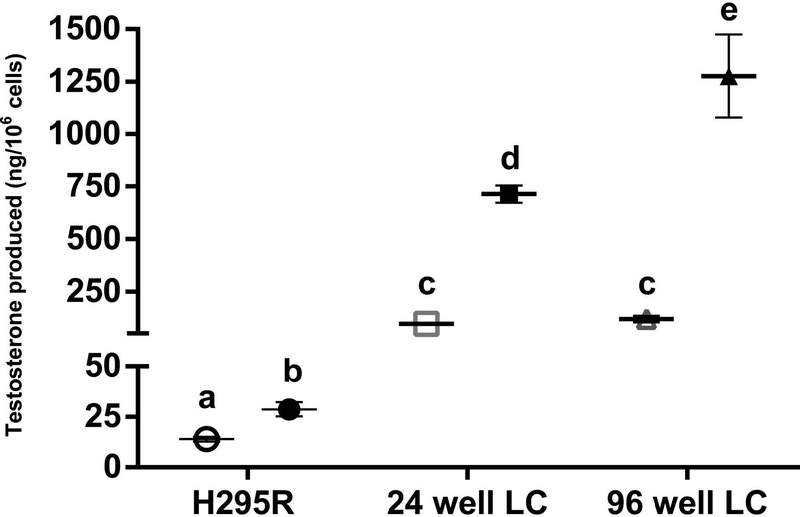
Figure 6.
Comparison of the dynamic range of testosterone production between the H295R steroidogenesis assay (Angela Buckalew, personal communication), the 24-well format of the Leydig cell (LC) assay, and the 96-well format of the Leydig cell assay. Markers represent mean ± SEM testosterone production (ng/106 cells) without (empty markers) and with stimulation (filled markers), respectively (10 μM forskolin = H295R assay; 100 ng/mL LH = LC assay) for two to eight independent replicates. Significant differences (P < 0.05) between unstimulated and stimulated testosterone production and differences between groups are denoted by different letters.

