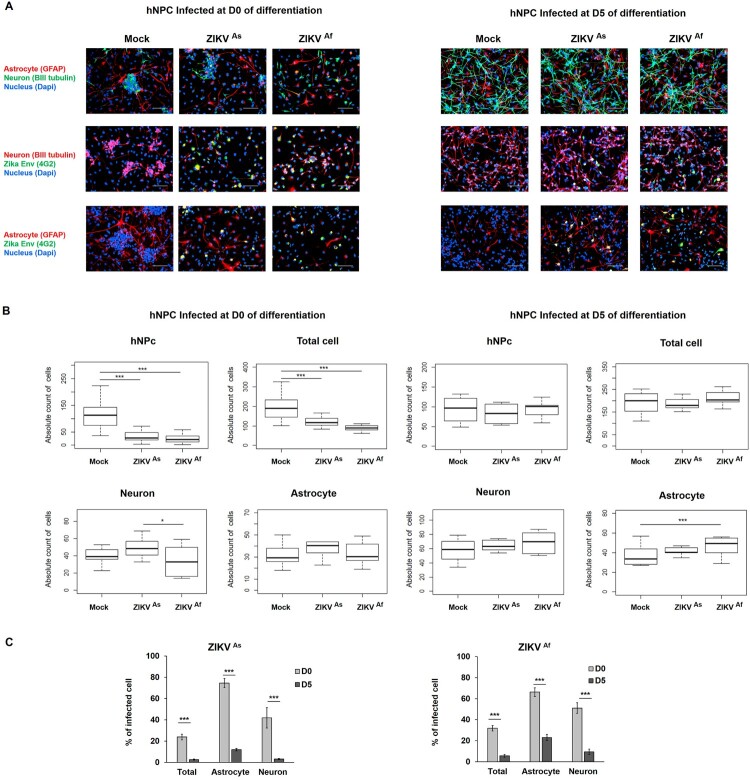
Figure 2.
Distribution of cell populations in ZIKV-infected D0- and D5-hNPCs. Immunostaining of ZIKV infected hNPC in process of differentiation with antibodies directed against βIII-Tubulin (neuronal marker, red), GFAP (astrocyte marker, red) and 4G2 (Flavivirus marker, green) at 72 hpi, scale bar 100 µm. Nuclei were stained with DAPI (blue) (A). Distribution of absolute counts of neurons, astrocytes, hNPCs and total cells was determined within 10 independent squares of 0.2 mm2, using box plot (B). Comparison between two groups was performed with a Tuckey’s range test with a P-value significant when *p < 0.05, **p < 0.01, ***p < 0.001. The percentage of infected cells were manually determined based on virus markers (C). Comparison between two groups was performed with a Mann-Whitney test with a P-value significant when *p < 0.05, **p < 0.01, ***p < 0.001.

