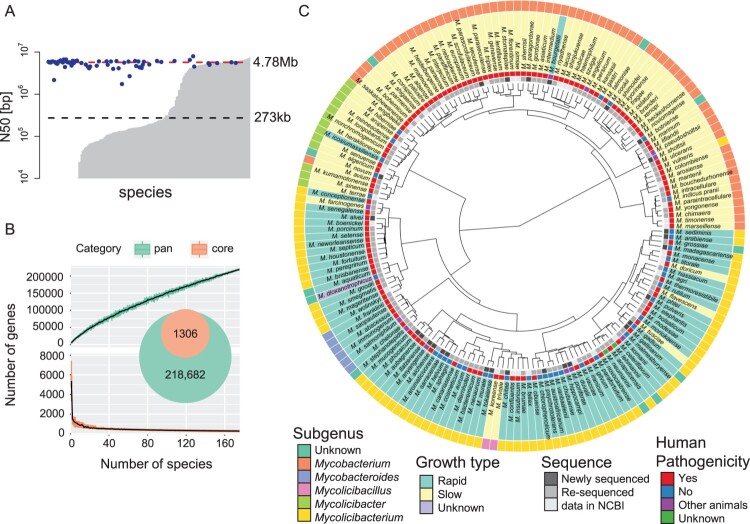
Figure 1.
Taxonomic analysis using all Mycobacterium species. A) Assembly quality. The bar plot indicates the N50 length in each species. The grey bar was available with the NCBI assemblies. The x-axis is sorted in ascending order with y-axis value. The blue dots show assemblies obtained in this work. The black and red dashed lines show the median N50s calculated using assemblies available from NCBI and our assemblies (also see Table S1). Growth type was defined according to the time required to grow bacterial colonies [i.e. rapid (3–7 days) and slow (>7 days)]. B) Core and pan genome analysis. Gene clusters were discriminated based on differences in the percent identity and length. The numbers of core (bottom) and pan (top) genes are shown, based on the number of NTM species. The error bars were calculated from 1000 replicates of randomly selected species. C) Comparative analysis. A phylogenetic tree was constructed using the 80% core genome (also see Figure S1). Filled colours correspond to the subgenus, growth type, pathogenicity, and assembly availability.

