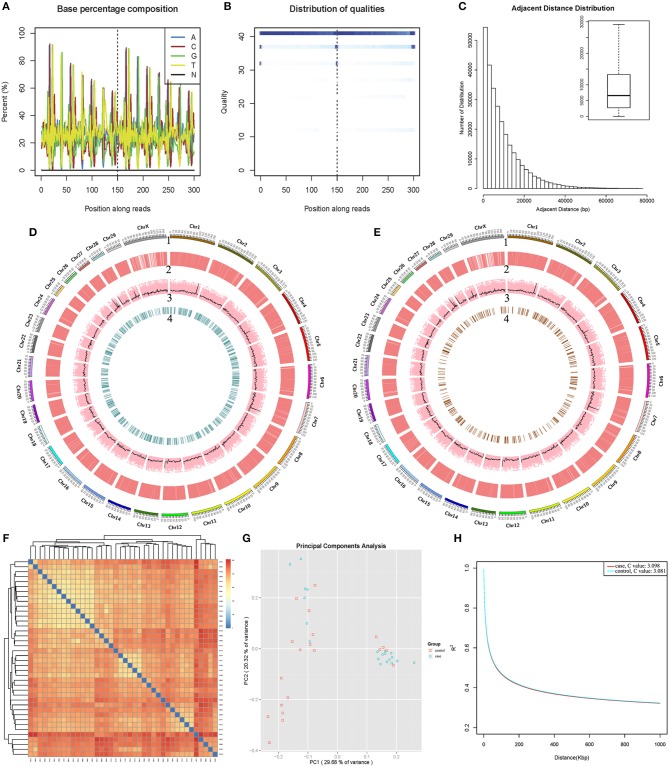
Figure 1.
2b-RADseq and biological information analysis of Chinese Holstein cows. (A) Proportion of A/C/G/T/N bases at each position: the abscissa was Reads base position, and ordinate were the bases' proportion; different colors represent base types, and the base that was not recognized in sequencing were labeled as N. (B) Sequencing base mass value at each position: the darker the color, the higher the base ratio of the mass value in the data. (C) Average spacing between adjacent tags: The horizontal line in the middle of the box plot is the average spacing between the labels. (D) Bayesian and (E) Logistic regression model analysis of SNPs quality traits in all samples (1–4): chromosome scale; SNPs for all samples; sequencing depth for each SNPs; significant SNPs (P < 0.05). (F) Differential SNP cluster analysis: The color difference indicates the number of difference SNPs between samples and the near-far relationship of clusters between samples. (G) Principal Component Analysis and RAD typing of SNPs: Abscissa represented principal component 1 (PC1); ordinate represented principal component 2 (PC2); each point was a sample with different shapes and colors representing different groups. (H) The Linkage Disequilibrium attenuation curve of case-control SNPs.

