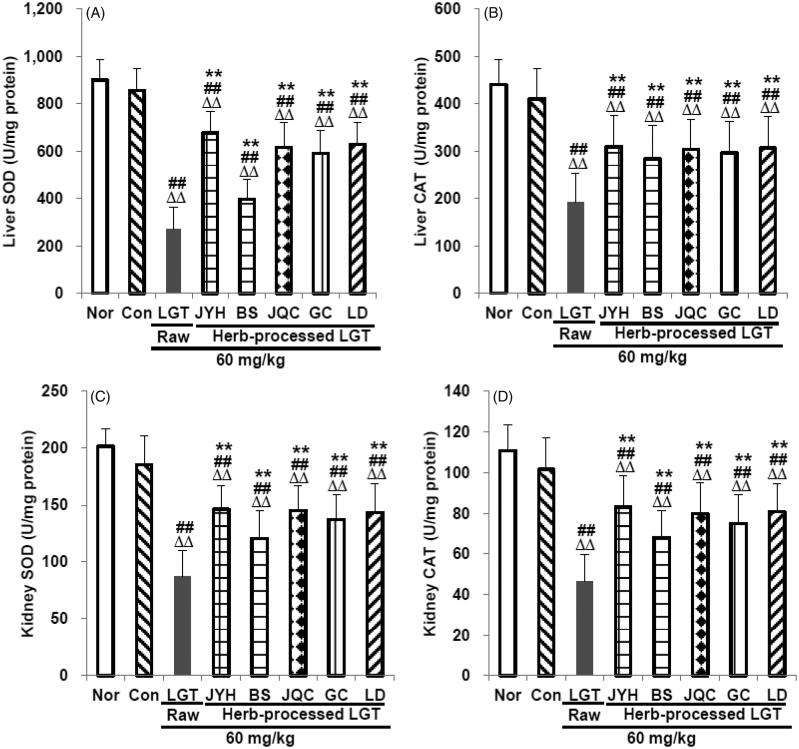
Figure 4.
Effects of processed LGT treatment on primary antioxidant enzymes SOD (A,C) and CAT (B,D) levels in liver and kidney of LGT-exposed S180 tumour-bearing mice. Significant differences compared with the normal (Nor) group were designated as ΔΔp < 0.01, with the control (Con) group as ##p < 0.01, and with LGT raw product group as **p < 0.01.

