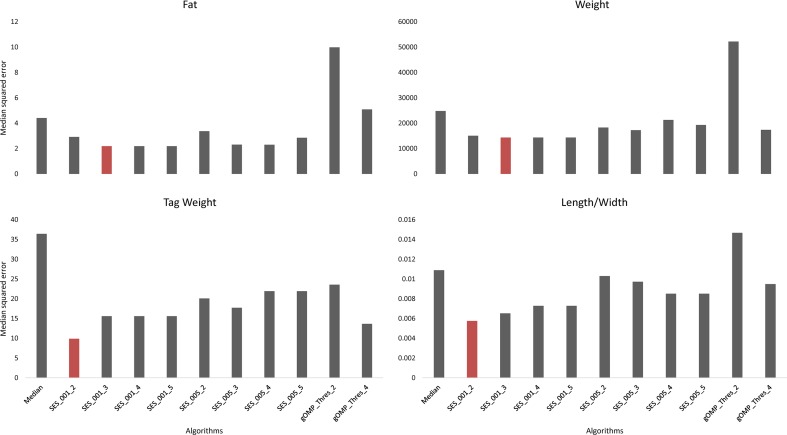
Figure 2.
Comparison of different algorithms predicting the traits of interest, based on median squared error, after leave one out cross validation. SES algorithm tested for different thresholds (Threshold equal to 0.01 or 0.05) and for different numbers of SNPs as condition set (k = 2, 3, 4, 5). OMP algorithm tested for different thresholds as stop criterion (Threshold = 2 or 4 units in BIC score).

