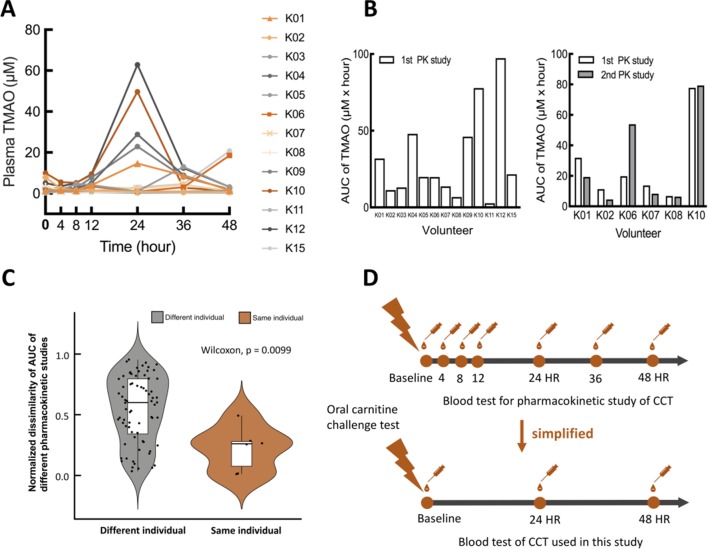
Figure 2.
Pharmacokinetic study of oral carnitine challenge test (OCCT). (A) Thirteen volunteers were recruited for a pharmacokinetic (PK) study of the OCCT. Each participant received three tablets of GNC L-carnitine (approximately 1200 mg L-carnitine) and blood drawings at 4th hour, 8th hour, 12th hour, 24th hour, 36th hour and 48th hour. (B) The bar plots of AUC in OCCT for different volunteers and the same volunteer with different PK studies (six volunteers received the second PK study 3 months later). (C) Normalised dissimilarity of AUC of different pharmacokinetic studies in the same and different individuals (defined as |AUC1−AUC2|/[AUC1+AUC2]) AUC1: AUCs of 1st PK study; AUC2: AUCs of second PK study. These data suggested the trend of TMAO production capacity is reproducible in the same individual periodically. (D) Validation and simplification of sample collection time points for the OCCT according to the results of pharmacokinetic studies. AUC, area under the curve; CCT, carnitine challenge test; TMAO, trimethylamine N-oxide.

