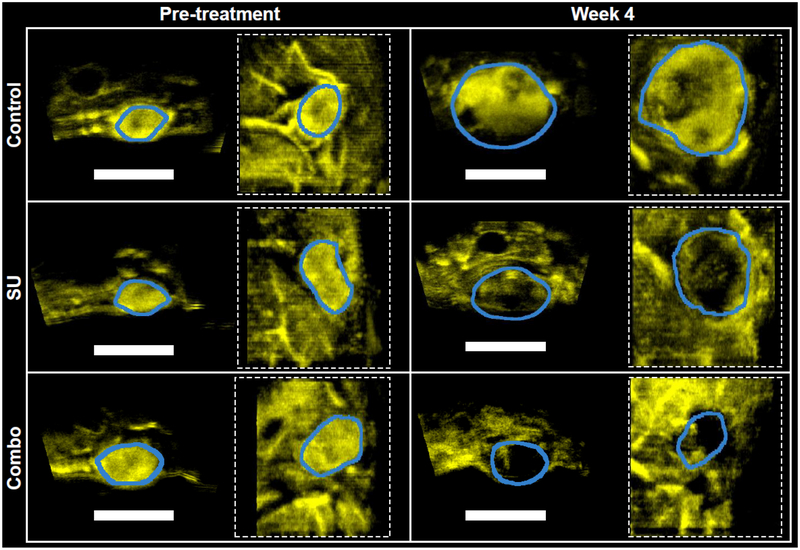
Fig. 1.
Representative vessel density images from the different treatment groups. Representative images are displayed at the beginning (left) and end (right) of the study. In each panel, the image on the left is a cross-section of the tumors while the image on the right (dashed square) is a coronal view. The scale bar represents 1 cm. Yellow indicates microvasculature acquired in AA mode. The blue outlines the tumor region of interest, and was derived via registered anatomical B-mode images (not shown).

