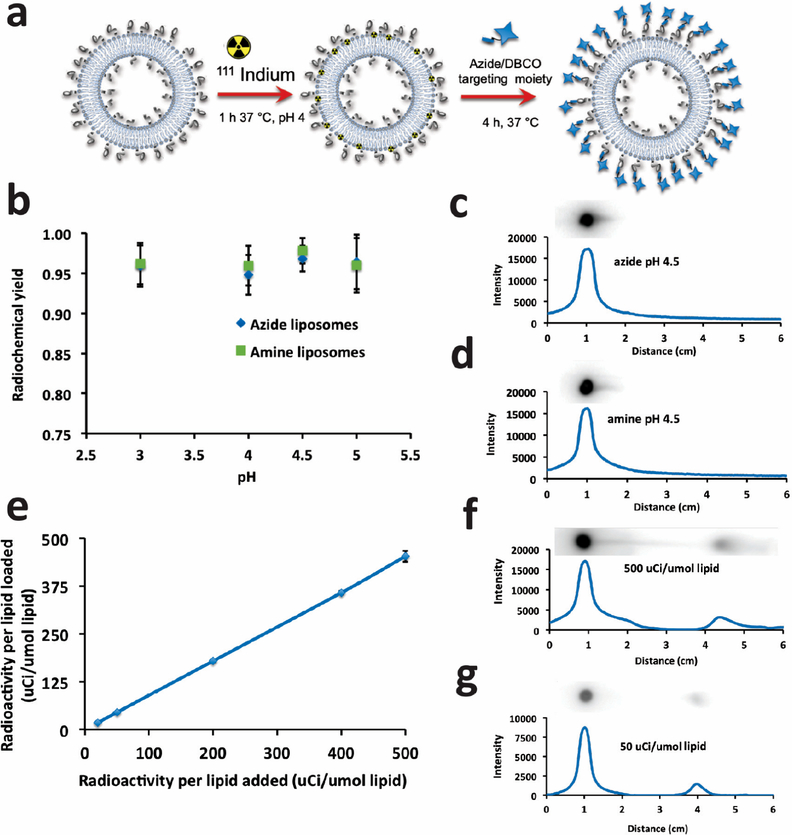
Figure 4.
111In labeling of clickable liposomes. (a) Schematic of labeling procedure. (b) Gamma quantification (origin vs total) of thin layer chromatography of unpurified, quenched amine and azide liposome reaction mixtures with range of pH 3–5. (c,d) Autoradiography of phosphor gel scan of representative TLC thin layer at pH 4.5 for each liposome type. Graphs represent gray scale intensity vs migration of reactive species from origin in EDTA mobile phase. (e) Radiochemical yield vs μCi activity loaded into azide liposomes demonstrates linear radiochemical yield and purity (~90% without purification) with no indication of reaching saturation. (f,g) Autoradiography and TLC quantification as in c and d of data from (e) of high (f) and low (g) addition. Phosphor TLC imaging corresponds with gamma counting.

