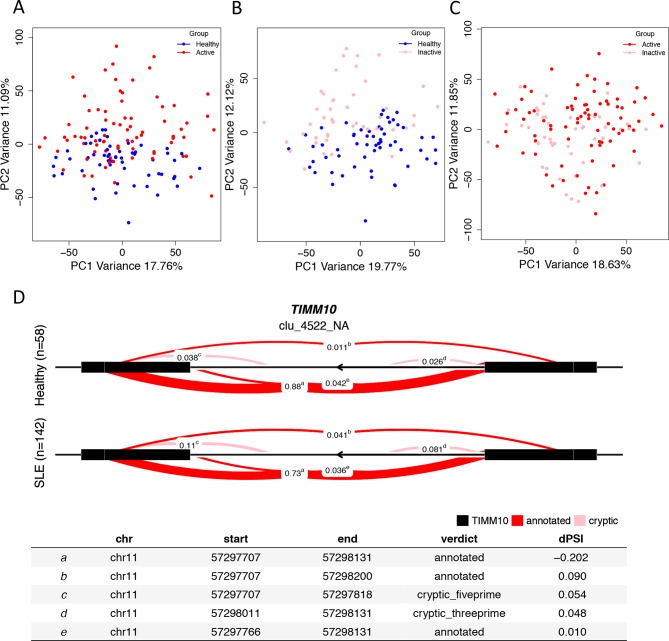
Figure 3.
Blood transcriptome variation in systemic lupus erythematosus (SLE) vs healthy individuals and differential mRNA splicing. (A) Principal component analysis (PCA) of whole transcriptome between healthy and active SLE individuals. The two first principal components (PC1, PC2) are plotted. PC2 can differentiate the two groups implying differences in gene expression. (B) PCA between healthy and inactive SLE individuals. PC2 can differentiate the two groups indicating that even in disease remission, the transcriptome of patients with SLE is different compared with healthy individuals. (C) PCA between active and inactive patients with SLE. The first two PCs do not differentiate the two groups suggesting the absence of significant differences in gene expression between them. (D) We characterised alternative splicing events by focusing on intron excisions. A cluster is defined as set of overlapping spliced junctions or introns. For each cluster, we calculated the PSI (percentage splicing intron) coverage and then normalised it as a fraction of the total counts. Each splicing event is plotted as a line connecting its start and end coordinates of the intron with a thickness proportional to the displayed normalised count value. Differential splicing is measured in terms of the difference in the per cent spliced in dPSI. Illustratively, in the case of TIMM10, the splicing event ‘a’ is more frequent in healthy (88%) as compared with SLE (73%) individuals; therefore, the difference in PSI (SLE vs healthy; dPSI) is −0.202.

