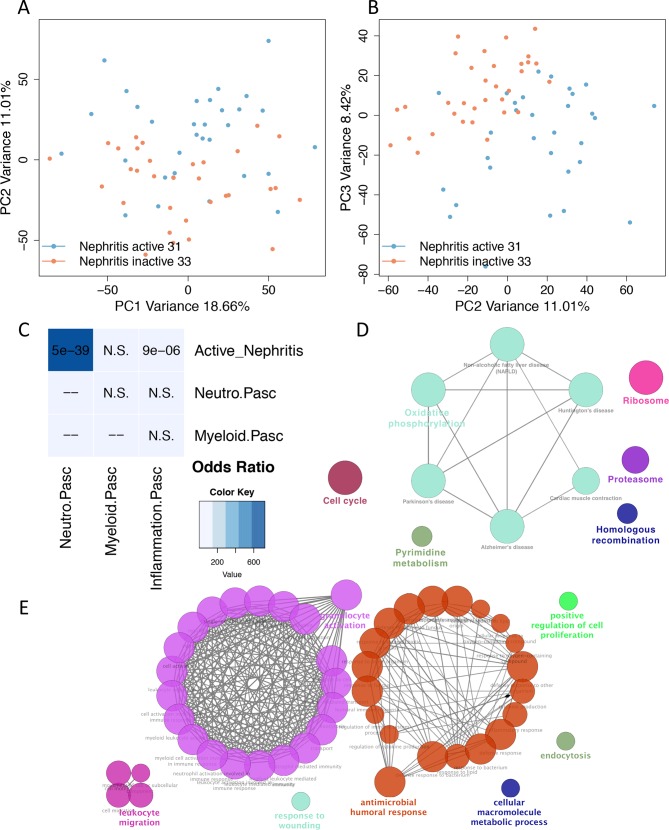
Figure 5.
Transcriptome analysis of lupus nephritis reveals prominent neutrophil and humoral response signatures. (A) Principal component analysis (PCA) of blood gene expression between active lupus nephritis and lupus nephritis in remission. PC1 and PC2 are plotted on x-axis and y-axis, respectively. PC2 is differentiating the two groups. (B) PC2 and PC3 are plotted on x-axis and y-axis, respectively. PC3 is also differentiating the two groups suggesting that PC2 and PC3 capture different transcriptome/biological aberrations involved in active lupus nephritis. (C) Comparison of neutrophil gene signature with data from a paediatric systemic lupus erythematosus (SLE) study (Banchereau and Pascual; Cell 2016). Fisher’s exact p values of overlap are plotted in accordance with the ORs denoted as heatmap. (D) Pathway enrichment analysis of the intersection of differentially expressed genes (DEGs) in active nephritis vs inactive SLE with those in active vs inactive SLE. (E) Functionally grouped networks of enriched GO term categories were generated for the 136 DEGs (5% false discovery rate) between patients with SLE with active nephritis vs those with activity from other organs. The main enriched terms are granulocyte activation and antimicrobial humoral response.

