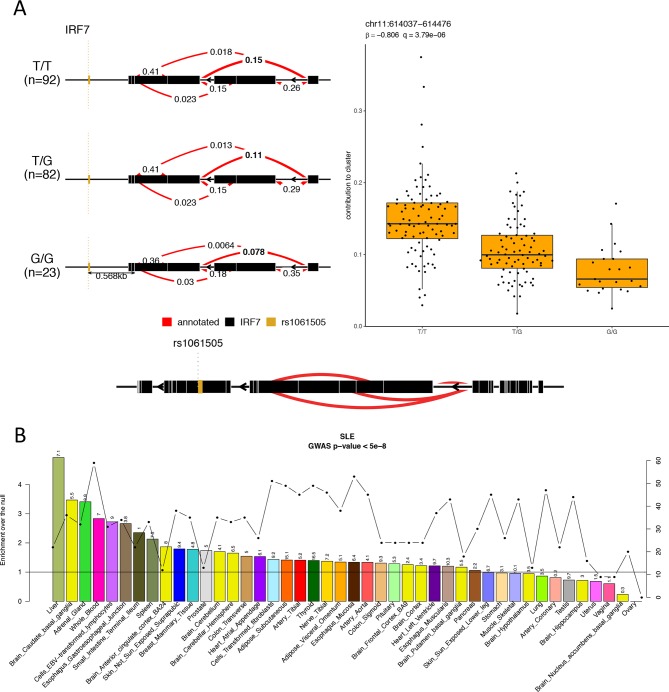
Figure 6.
Systemic lupus erythematosus (SLE)-susceptibility variants regulate gene expression in blood and non-blood tissues. (A) Splicing QTL example for the gene IRF7. Individuals with SLE carrying the TT genotype show higher contribution of the same splicing event to the intron cluster compared with individuals carrying the GG genotype. (B) To address the impact of SLE GWAS (genome-wide association study) polymorphisms on gene expression across different tissues, we used the eQTL data in 44 tissues from GTEx6 and calculated the tissue-sharing probabilities of eQTLs and the probabilities that a SLE GWAS polymorphism and the eQTL tag the same functional effect. On the primary y-axis, the enrichments-over-the-null per tissue are plotted as bars; on the secondary y-axis, the number of SLE GWAS variants that colocalise with eQTLs per tissue are plotted as dotted line. The horizontal black line indicates the null. On top of each bars are the −log10 Benjamini-Hochberg–corrected p values for the enrichments.

