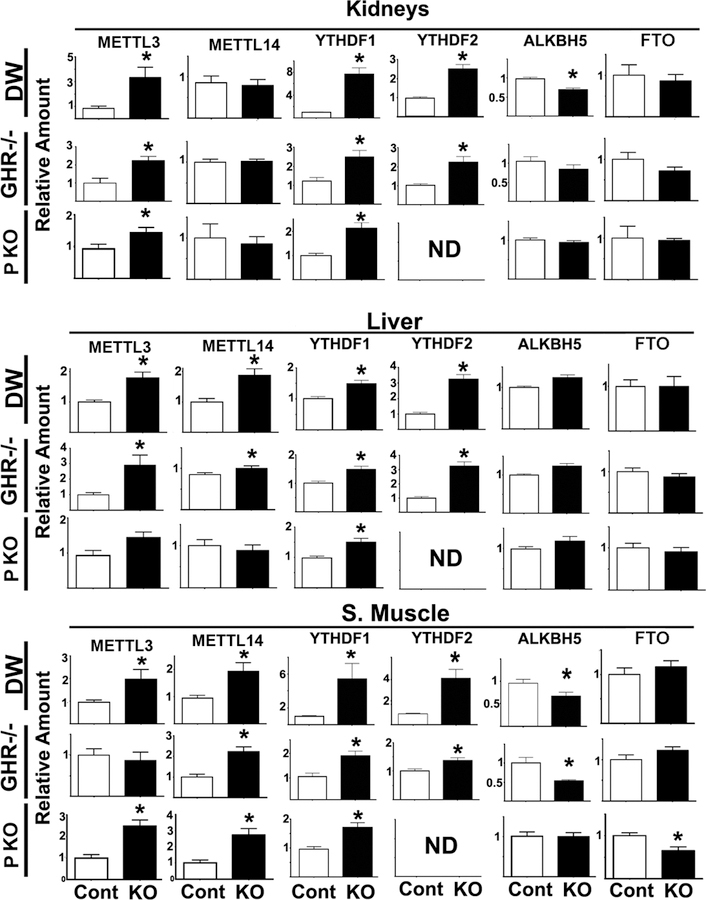
Figure 4. METTL3/14, YTHDF1/2, ALKBH5 and FTO protein levels in different tissues of DW, GHR−/− and PKO mice.
Bars represent the mean ± S.E.M.SEM from 6 independent experiments totaling at least 20 mice per group (half males). All values are shown relative to mean levels of control mice. The (*) indicates statistical significance (p<0.05) relative to controls. ND = not detected.

